

Oakland Walks!
oak063431
oak063431

Create successful ePaper yourself
Turn your PDF publications into a flip-book with our unique Google optimized e-Paper software.
OakDOT<br />
Call Dangerous out titleBy Design<br />
In addition to human factors, the following<br />
physical characteristics of the roadway network<br />
have been found to be common across the<br />
high-priority collision locations (listed in no<br />
particular order).<br />
• More than four traffic lanes (two or more each way)<br />
with no median<br />
• No pedestrian signal or countdown signal<br />
• No pedestrian call button<br />
• Off-set or closely spaced intersections (within 80-150<br />
feet of one another)<br />
• One or more bus stops<br />
A 2015 study of 42 high-collision intersections<br />
in <strong>Oakland</strong> identified additional characteristics<br />
that are associated with a high risk of pedestrian<br />
collisions, including:<br />
• Parallel curb parking with a daylighting (restriction of<br />
parking near an intersection) distance of less than 15<br />
feet<br />
• Having at least one intersection approach without a<br />
marked crosswalk<br />
• Having an average curb to curb street crossing<br />
distance of greater than 66 feet<br />
Pedestrian Collisions by Race<br />
<strong>Oakland</strong> is the most racially diverse city<br />
in America, 3, 4 with an overall population<br />
that is 74% non-white and approximately<br />
equal proportions of white, African<br />
American and Hispanic/Latino residents.<br />
Nonetheless, racial and ethnic traffic<br />
fatalities varies greatly, as shown in Table<br />
2.4.<br />
Studies show a strong relationship<br />
between race and the likelihood of being<br />
killed by a vehicle as a pedestrian. 5<br />
The Centers for Disease Control found<br />
that nationwide, African American and<br />
Hispanic people have twice the likelihood<br />
of being killed in a pedestrian collision as<br />
people of other races and ethnicities. 5<br />
At the Statewide level, Asian/Pacific<br />
Islanders 65 years and older have the<br />
highest death and hospitalization rates<br />
of any age group. Locally, Figure 2.4<br />
shows that <strong>Oakland</strong> pedestrians of Asian<br />
descent die at twice the citywide rate.<br />
The Black and Hispanic population in<br />
<strong>Oakland</strong> is almost twice as likely to die in<br />
a pedestrian collision as the<br />
White population. This data reflects<br />
that in <strong>Oakland</strong>, as in many American<br />
communities, people of color often live,<br />
and therefore walk, in particular areas of<br />
the City where walking conditions may<br />
be safe.<br />
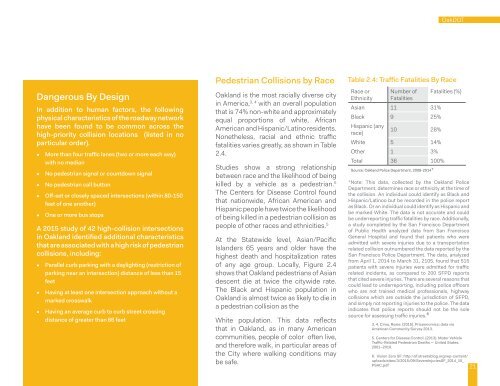
Table 2.4: Traffic Fatalities By Race<br />
Race or<br />
Ethnicity<br />
Number of<br />
Fatalities<br />
Asian 11 31%<br />
Black 9 25%<br />
Hispanic (any<br />
race)<br />
10 28%<br />
White 5 14%<br />
Other 1 3%<br />
Total 36 100%<br />
Source: <strong>Oakland</strong> Police Department, 2008-2014*<br />
Fatalities (%)<br />
*Note: This data, collected by the <strong>Oakland</strong> Police<br />
Department, determines race or ethnicity at the time of<br />
the collision. An individual could identify as Black and<br />
Hispanic/Latinoo but be recorded in the police report<br />
as Black. Or an individual could identify as Hispanic and<br />
be marked White. The data is not accurate and could<br />
be underreporting traffic fatalities by race. Additionally,<br />
a study completed by the San Francisco Department<br />
of Public Health analyzed data from San Francisco<br />
General Hospital and found that patients who were<br />
admitted with severe injuries due to a transportation<br />
related collision outnumbered the data reported by the<br />
San Francisco Police Department. The data, analyzed<br />
from April 1, 2014 to March 31, 2105, found that 515<br />
patients with severe injuries were admitted for traffic<br />
related incidents, as compared to 200 SFPD reports<br />
that cited severe injuries. There are several reasons that<br />
could lead to underreporting, including police officers<br />
who are not trained medical professionals, highway<br />
collisions which are outside the jurisdiction of SFPD,<br />
and simply not reporting injuries to the police. The data<br />
indicates that police reports should not be the sole<br />
source for assessing traffic injuries.6<br />
3, 4. Cima, Rosie. (2015). Priceonomics; data via<br />
American Community Survey 2013.<br />
5. Centers for Disease Control. (2013). Motor Vehicle<br />
Traffic-Related Pedestrian Deaths — United States,<br />
2001–2010.<br />
6. Vision Zero SF: http://sf.streetsblog.org/wp-content/<br />
uploads/sites/3/2015/09/SevereInjuriesSF_2014_15_<br />
PSAC.pdf<br />
21