

Oakland Walks!
oak063431
oak063431

Create successful ePaper yourself
Turn your PDF publications into a flip-book with our unique Google optimized e-Paper software.
OakDOT<br />
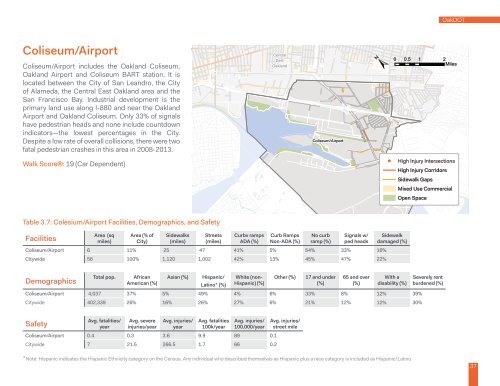
Coliseum/Airport<br />
Coliseum/Airport includes the <strong>Oakland</strong> Coliseum,<br />
<strong>Oakland</strong> Airport and Coliseum BART station. It is<br />
located between the City of San Leandro, the City<br />
of Alameda, the Central East <strong>Oakland</strong> area and the<br />
San Francisco Bay. Industrial development is the<br />
primary land use along I-880 and near the <strong>Oakland</strong><br />
Airport and <strong>Oakland</strong> Coliseum. Only 33% of signals<br />
have pedestrian heads and none include countdown<br />
indicators—the lowest percentages in the City.<br />
Despite a low rate of overall collisions, there were two<br />
fatal pedestrian crashes in this area in 2008-2013.<br />
Central<br />
East<br />
<strong>Oakland</strong><br />
Coliseum/Airport<br />
Hegenbergerz<br />
±<br />
±<br />
0 0.5 1<br />
2<br />
Miles<br />
Walk Score®: 19 (Car Dependent)<br />
High Injury Intersections<br />
High Injury Corridors<br />
Sidewalk Gaps<br />
Mixed Use Commercial<br />
Open Space<br />
Table 3.7: Colesium/Airport Facilities, Demographics, and Safety<br />
Facilities<br />
Area (sq<br />
miles)<br />
Area (% of<br />
City)<br />
Sidewalks<br />
(miles)<br />
Streets<br />
(miles)<br />
Curbv ramps<br />
ADA (%)<br />
Curb Ramps<br />
Non-ADA (%)<br />
No curb<br />
ramp (%)<br />
Signals w/<br />
ped heads<br />
Coliseum/Airport 6 11% 25 47 41% 5% 54% 33% 16%<br />
Citywide 56 100% 1,120 1,002 42% 13% 45% 47% 22%<br />
Sidewalk<br />
damaged (%)<br />
Demographics<br />
Total pop.<br />
African<br />
American (%)<br />
Asian (%)<br />
Hispanic/<br />
Latino* (%)<br />
White (non-<br />
Hispanic) (%)<br />
Other (%)<br />
17 and under<br />
(%)<br />
65 and over<br />
(%)<br />
With a<br />
disability (%)<br />
Coliseum/Airport 4,037 37% 5% 49% 4% 6% 33% 8% 12% 39%<br />
Citywide 402,339 26% 16% 26% 27% 6% 21% 12% 12% 30%<br />
Severely rent<br />
burdened (%)<br />
Safety<br />
Avg. fatalities/<br />
year<br />
Avg. severe<br />
injuries/year<br />
Avg. injuries/<br />
year<br />
Avg. fatalities<br />
100k/year<br />
Avg. injuries/<br />
100,000/year<br />
Coliseum/Airport 0.4 0.3 3.6 9.9 89 0.1<br />
Citywide 7 21.5 266.5 1.7 66 0.2<br />
Avg. injuries/<br />
street mile<br />
*Note: Hispanic indicates the Hispanic Ethnicity category on the Census. Any individual who described themselves as Hispanic plus a race category is included as Hispanic/Latino.<br />
37