

Oakland Walks!
oak063431
oak063431

You also want an ePaper? Increase the reach of your titles
YUMPU automatically turns print PDFs into web optimized ePapers that Google loves.
OakDOT<br />
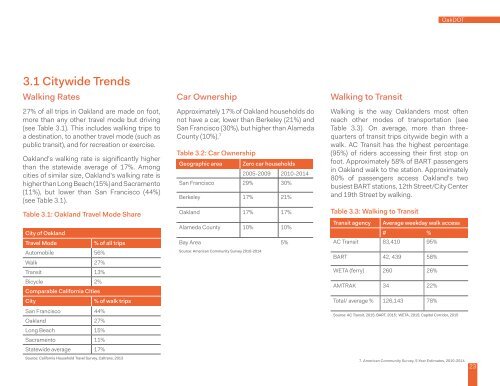
3.1 Citywide Trends<br />
Walking Rates<br />
27% of all trips in <strong>Oakland</strong> are made on foot,<br />
more than any other travel mode but driving<br />
(see Table 3.1). This includes walking trips to<br />
a destination, to another travel mode (such as<br />
public transit), and for recreation or exercise.<br />
<strong>Oakland</strong>’s walking rate is significantly higher<br />
than the statewide average of 17%. Among<br />
cities of similar size, <strong>Oakland</strong>’s walking rate is<br />
higher than Long Beach (15%) and Sacramento<br />
(11%), but lower than San Francisco (44%)<br />
(see Table 3.1).<br />
Table 3.1: <strong>Oakland</strong> Travel Mode Share<br />
t<br />
City of <strong>Oakland</strong><br />
Travel Mode<br />
Automobile 56%<br />
Walk 27%<br />
Transit 13%<br />
Bicycle 2%<br />
Comparable California Cities<br />
City<br />
San Francisco 44%<br />
<strong>Oakland</strong> 27%<br />
Long Beach 15%<br />
Sacramento 11%<br />
Statewide average 17%<br />
% of all trips<br />
% of walk trips<br />
Source: California Household Travel Survey, Caltrans, 2013<br />
Car Ownership<br />
Approximately 17% of <strong>Oakland</strong> households do<br />
not have a car, lower than Berkeley (21%) and<br />
San Francisco (30%), but higher than Alameda<br />
County (10%). 7<br />
Table 3.2: Car Ownership<br />
Geographic area<br />
Zero car households<br />
2005-2009 2010-2014<br />
San Francisco 29% 30%<br />
Berkeley 17% 21%<br />
<strong>Oakland</strong> 17% 17%<br />
Alameda County 10% 10%<br />
Bay Area 5%<br />
Source: American Community Survey 2010-2014<br />
Walking to Transit<br />
Walking is the way <strong>Oakland</strong>ers most often<br />
reach other modes of transportation (see<br />
Table 3.3). On average, more than threequarters<br />
of transit trips citywide begin with a<br />
walk. AC Transit has the highest percentage<br />
(95%) of riders accessing their first stop on<br />
foot. Approximately 58% of BART passengers<br />
in <strong>Oakland</strong> walk to the station. Approximately<br />
80% of passengers access <strong>Oakland</strong>’s two<br />
busiest BART stations, 12th Street/City Center<br />
and 19th Street by walking.<br />
Table 3.3: Walking to Transit<br />
Transit agency<br />
Average weekday walk access<br />
# %<br />
AC Transit 83,410 95%<br />
BART 42, 439 58%<br />
WETA (ferry) 260 26%<br />
AMTRAK 34 22%<br />
Total/ average % 126,143 78%<br />
Source: AC Transit, 2015; BART, 2015; WETA, 2015; Capitol Corridor, 2015<br />
7. American Community Survey, 5-Year Estimates, 2010-2014.<br />
23