Abacus Property Group – Annual Financial Report 2017
Abacus Property Group – Annual Financial Report 2017
Abacus Property Group – Annual Financial Report 2017

You also want an ePaper? Increase the reach of your titles
YUMPU automatically turns print PDFs into web optimized ePapers that Google loves.
DIRECTORS’ REPORT<br />
30 June <strong>2017</strong><br />
ABACUS PROPERTY GROUP<br />
OPERATING AND FINANCIAL REVIEW (continued)<br />
CORE SEGMENT RESULTS SUMMARY (continued)<br />
Self-storage<br />
<strong>Abacus</strong>’ self-storage portfolio delivered a segment result of $70.7 million for the year ended 30 June <strong>2017</strong>. This<br />
represents a 5.2% decrease on the FY16’s result of $74.6 million and can be attributed to a lower level of fair<br />
value increases from the self-storage portfolio offsetting a 14% increase in self-storage EBITDA. Portfolio assets<br />
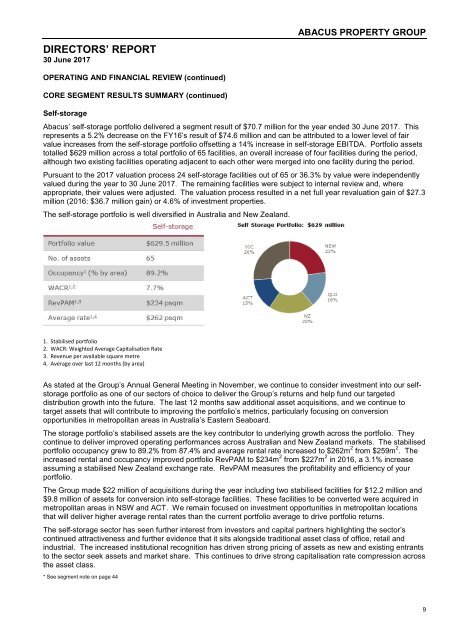
totalled $629 million across a total portfolio of 65 facilities, an overall increase of four facilities during the period,<br />
although two existing facilities operating adjacent to each other were merged into one facility during the period.<br />
Pursuant to the <strong>2017</strong> valuation process 24 self-storage facilities out of 65 or 36.3% by value were independently<br />
valued during the year to 30 June <strong>2017</strong>. The remaining facilities were subject to internal review and, where<br />
appropriate, their values were adjusted. The valuation process resulted in a net full year revaluation gain of $27.3<br />
million (2016: $36.7 million gain) or 4.6% of investment properties.<br />
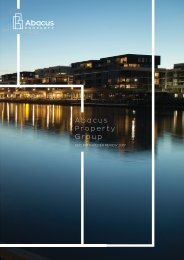
The self-storage portfolio is well diversified in Australia and New Zealand.<br />
1. Stabilised portfolio<br />
2. WACR: Weighted Average Capitalisation Rate<br />
3. Revenue per available square metre<br />
4. Average over last 12 months (by area)<br />
As stated at the <strong>Group</strong>’s <strong>Annual</strong> General Meeting in November, we continue to consider investment into our selfstorage<br />
portfolio as one of our sectors of choice to deliver the <strong>Group</strong>’s returns and help fund our targeted<br />
distribution growth into the future. The last 12 months saw additional asset acquisitions, and we continue to<br />
target assets that will contribute to improving the portfolio’s metrics, particularly focusing on conversion<br />
opportunities in metropolitan areas in Australia’s Eastern Seaboard.<br />
The storage portfolio’s stabilised assets are the key contributor to underlying growth across the portfolio. They<br />
continue to deliver improved operating performances across Australian and New Zealand markets. The stabilised<br />
portfolio occupancy grew to 89.2% from 87.4% and average rental rate increased to $262m 2 from $259m 2 . The<br />
increased rental and occupancy improved portfolio RevPAM to $234m 2 from $227m 2 in 2016, a 3.1% increase<br />
assuming a stabilised New Zealand exchange rate. RevPAM measures the profitability and efficiency of your<br />
portfolio.<br />
The <strong>Group</strong> made $22 million of acquisitions during the year including two stabilised facilities for $12.2 million and<br />
$9.8 million of assets for conversion into self-storage facilities. These facilities to be converted were acquired in<br />
metropolitan areas in NSW and ACT. We remain focused on investment opportunities in metropolitan locations<br />
that will deliver higher average rental rates than the current portfolio average to drive portfolio returns.<br />
The self-storage sector has seen further interest from investors and capital partners highlighting the sector’s<br />
continued attractiveness and further evidence that it sits alongside traditional asset class of office, retail and<br />
industrial. The increased institutional recognition has driven strong pricing of assets as new and existing entrants<br />
to the sector seek assets and market share. This continues to drive strong capitalisation rate compression across<br />
the asset class.<br />
* See segment note on page 44<br />
9