Abacus Property Group – Annual Financial Report 2017
Abacus Property Group – Annual Financial Report 2017
Abacus Property Group – Annual Financial Report 2017

You also want an ePaper? Increase the reach of your titles
YUMPU automatically turns print PDFs into web optimized ePapers that Google loves.
ABACUS PROPERTY GROUP<br />
45<br />
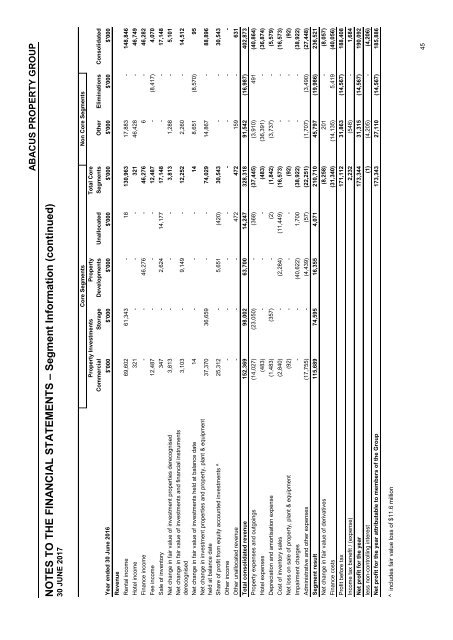
NOTES TO THE FINANCIAL STATEMENTS <strong>–</strong> Segment Information (continued)<br />
30 JUNE <strong>2017</strong><br />
Core Segments Non Core Segments<br />
<strong>Property</strong> Investments<br />
<strong>Property</strong> Total Core<br />
Commercial Storage Developments Unallocated Segments Other Eliminations Consolidated<br />
Year ended 30 June 2016 $'000 $'000 $'000 $'000 $'000 $'000 $'000 $'000<br />
Revenue<br />
Rental income 69,602 61,343 - 18 130,963 17,883 - 148,846<br />
Hotel income 321 - - - 321 46,428 - 46,749<br />
Finance income - - 46,276 - 46,276 6 - 46,282<br />
Fee income 12,487 - - - 12,487 - (8,417) 4,070<br />
Sale of inventory 347 - 2,624 14,177 17,148 - - 17,148<br />
Net change in fair value of investment properties derecognised 3,813 - - - 3,813 1,288 - 5,101<br />
Net change in fair value of investments and financial instruments<br />
3,103 - 9,149 - 12,252 2,260 - 14,512<br />
derecognised<br />
Net change in fair value of investments held at balance date 14 - - - 14 8,651 (8,570) 95<br />
Net change in investment properties and property, plant & equipment<br />
37,370 36,659 - - 74,029 14,867 - 88,896<br />
held at balance date<br />
Share of profit from equity accounted investments ^ 25,312 - 5,651 (420) 30,543 - - 30,543<br />
Other income - - - - - - - -<br />
Other unallocated revenue - - - 472 472 159 - 631<br />
Total consolidated revenue 152,369 98,002 63,700 14,247 328,318 91,542 (16,987) 402,873<br />
<strong>Property</strong> expenses and outgoings (14,027) (23,050) - (368) (37,445) (3,910) 491 (40,864)<br />
Hotel expenses (483) - - - (483) (36,391) - (36,874)<br />
Depreciation and amortisation expense (1,483) (357) - (2) (1,842) (3,737) - (5,579)<br />
Cost of inventory sales (2,840) - (2,284) (11,449) (16,573) - - (16,573)<br />
Net loss on sale of property, plant & equipment (92) - - - (92) - - (92)<br />
Impairment charges - - (40,622) 1,700 (38,922) - - (38,922)<br />
Administrative and other expenses (17,755) - (4,439) (57) (22,251) (1,707) (3,490) (27,448)<br />
Segment result 115,689 74,595 16,355 4,071 210,710 45,797 (19,986) 236,521<br />
Net change in fair value of derivatives (8,258) 201 - (8,057)<br />
Finance costs (31,340) (14,135) 5,419 (40,056)<br />
Profit before tax 171,112 31,863 (14,567) 188,408<br />
Income tax benefit / (expense) 2,232 (548) - 1,684<br />
Net profit for the year 173,344 31,315 (14,567) 190,092<br />
less non-controlling interest (1) (4,205) - (4,206)<br />
Net profit for the year attributable to members of the <strong>Group</strong><br />
173,343 27,110 (14,567) 185,886<br />
^ includes fair value loss of $11.6 million