Abacus Property Group – Annual Financial Report 2017
Abacus Property Group – Annual Financial Report 2017
Abacus Property Group – Annual Financial Report 2017

You also want an ePaper? Increase the reach of your titles
YUMPU automatically turns print PDFs into web optimized ePapers that Google loves.
DIRECTORS’ REPORT<br />
30 June <strong>2017</strong><br />
ABACUS PROPERTY GROUP<br />
OPERATING AND FINANCIAL REVIEW (continued)<br />
GROUP RESULTS SUMMARY (continued)<br />
Capital management<br />
The <strong>Abacus</strong> balance sheet continues to be strong with gearing remaining conservative at 20.5%, well within our<br />
target gearing limit of 35%. At 30 June <strong>2017</strong>, <strong>Abacus</strong> had $295 million of available liquidity that provides capacity<br />
for use for up to $519 million of accretive acquisitions.<br />
We continue to improve and reweight the balance sheet to larger, higher quality assets with a focus on disciplined<br />
capital management strategies. We anticipate <strong>Abacus</strong>’ weighted average interest rate will remain relatively stable<br />
as current capacity is utilised and anticipate it should be no greater than 5.50% over the next year.<br />
CORE SEGMENT RESULTS SUMMARY<br />
Business activities that specifically contributed to the <strong>Abacus</strong>’ operating performance and financial condition for<br />
the financial year were:<br />
<strong>Property</strong> Investment<br />
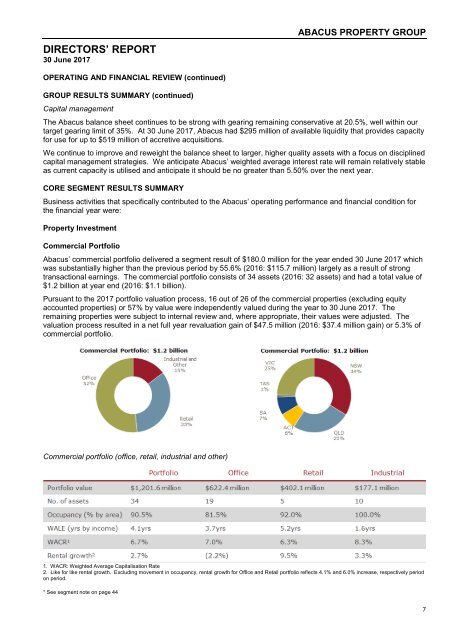
Commercial Portfolio<br />
<strong>Abacus</strong>’ commercial portfolio delivered a segment result of $180.0 million for the year ended 30 June <strong>2017</strong> which<br />
was substantially higher than the previous period by 55.6% (2016: $115.7 million) largely as a result of strong<br />
transactional earnings. The commercial portfolio consists of 34 assets (2016: 32 assets) and had a total value of<br />
$1.2 billion at year end (2016: $1.1 billion).<br />
Pursuant to the <strong>2017</strong> portfolio valuation process, 16 out of 26 of the commercial properties (excluding equity<br />
accounted properties) or 57% by value were independently valued during the year to 30 June <strong>2017</strong>. The<br />
remaining properties were subject to internal review and, where appropriate, their values were adjusted. The<br />
valuation process resulted in a net full year revaluation gain of $47.5 million (2016: $37.4 million gain) or 5.3% of<br />
commercial portfolio.<br />
Commercial portfolio (office, retail, industrial and other)<br />
1. WACR: Weighted Average Capitalisation Rate<br />
2. Like for like rental growth. Excluding movement in occupancy, rental growth for Office and Retail portfolio reflects 4.1% and 6.0% increase, respectively period<br />
on period.<br />
* See segment note on page 44<br />
7