- Page 1 and 2:
1 99
- Page 3 and 4:
Table of Contents Introduction ....
- Page 5 and 6:
WinJS Tools for Pages and Page Navi
- Page 7 and 8:
Chapter 6: Layout .................
- Page 9 and 10:
Design Guidelines for Settings ....
- Page 11 and 12:
Manipulating Audio and Video ......
- Page 13 and 14:
Managing Secondary Tiles ..........
- Page 15 and 16:
The User Profile (and the Lock Scre
- Page 17 and 18:
The Windows Store APIs ............
- Page 19 and 20:
Introduction Welcome, my friends, t
- Page 21 and 22:
I'm also assuming that your interes
- Page 23 and 24:
Acknowledgements In many ways, this
- Page 25 and 26:
Support for developers, however, ca
- Page 27 and 28:
technologies, including DirectX, XA
- Page 29 and 30:
The upload process will walk you th
- Page 31 and 32:
FIGURE 1-2 A typical app page in th
- Page 33 and 34:
do this, I’m sure!). In a hotel,
- Page 35 and 36:
The app host is more or less Intern
- Page 37 and 38:
Sidebar: Mixed Language Apps Window
- Page 39 and 40:
When snapped, on the other hand, ap
- Page 41 and 42:
Capability Description Prompts for
- Page 43 and 44:
Taking a Break, Getting Some Rest:
- Page 45 and 46:
So you might say, “Well, I should
- Page 47 and 48:
that the user has to configure the
- Page 49 and 50:
Fortunately, the Windows Store dash
- Page 51 and 52:
graphics called for in the design s
- Page 53 and 54:
4. After Visual Studio churns for a
- Page 55 and 56:
Add-AppxDevPackage. That batch file
- Page 57 and 58:
package, whereas a single / refers
- Page 59 and 60:
QuickStart #1: Here My Am! and an I
- Page 61 and 62:
FIGURE 2-8 Snapped wireframe (left;
- Page 63 and 64:
which we’ll instantiate a Bing ma
- Page 65 and 66:
orientation, screen resolution, and
- Page 67 and 68:
FIGURE 2-12 Full-screen landscape v
- Page 69 and 70:
What this means is that, for the mo
- Page 71 and 72:
Create the map (though the namespac
- Page 73 and 74:
Next, in the second parameter to po
- Page 75 and 76:
FIGURE 2-17 Setting the Location ca
- Page 77 and 78:
Here we’re providing capturePhoto
- Page 79 and 80:
the contract is an abstraction that
- Page 81 and 82:
Extra Credit: Receiving Messages fr
- Page 83 and 84:
Note that such apps might not be ab
- Page 85 and 86:
Chapter 3 App Anatomy and Page Navi
- Page 87 and 88:
content and controls from web servi
- Page 89 and 90:
Such capabilities are blocked becau
- Page 91 and 92:
Can you do any kind of dynamic page
- Page 93 and 94:
appdata. This happens via Windows.S
- Page 95 and 96:
I don’t know about you, but I rea
- Page 97 and 98:
telling you to not use it! After al
- Page 99 and 100:
App Activation First, let me congra
- Page 101 and 102:
In the table, note that 80% scale t
- Page 103 and 104:
Activation Code Paths As we saw in
- Page 105 and 106:
splashScreen SplashScreen Contains
- Page 107 and 108:
In truth, so long as the user keeps
- Page 109 and 110:
Of course, setPromise ultimately do
- Page 111 and 112:
previousExecutionState values are d
- Page 113 and 114:
object to which you can add whateve
- Page 115 and 116:
Because we stored lastPosition in s
- Page 117 and 118:
FIGURE 3-9 The output of the Simple
- Page 119 and 120:
What about launching from the previ
- Page 121 and 122:
For all other details on this funct
- Page 123 and 124:
The Navigation App Template, PageCo
- Page 125 and 126:
(function () { "use strict"; WinJS.
- Page 127 and 128:
}, ); if (that.pageElement.winContr
- Page 129 and 130:
Sidebar: Helping Out IntelliSense I
- Page 131 and 132:
thousands of items, where tapping a
- Page 133 and 134:
Completing the Promises Story Whew!
- Page 135 and 136:
mechanism on top of singular XHR op
- Page 137 and 138:
The story of controls in Windows 8
- Page 139 and 140:
Creating or instantiating HTML cont
- Page 141 and 142:
Hyperlink href, target Link text L
- Page 143 and 144:
defined as part of the WinJS.UI nam
- Page 145 and 146:
Clearly, then, the bulk of the work
- Page 147 and 148:
var element = document.getElementBy
- Page 149 and 150:
This example is taken directly from
- Page 151 and 152:
FIGURE 4-7 Expanding a WinJS contro
- Page 153 and 154:
Flexbox -ms-[inline-]flexbox (value
- Page 155 and 156:
Note Though not shown here, you can
- Page 157 and 158:
For the ToggleSwitch, win-* classes
- Page 159 and 160:
• If a WinJS.UI.Tooltip is gettin
- Page 161 and 162:
Custom Control Examples To see thes
- Page 163 and 164:
Between calendar.js and calendar.cs
- Page 165 and 166:
]]> Whe
- Page 167 and 168:
This would be appropriate if you cr
- Page 169 and 170:
Two-way: essentially one-way bindin
- Page 171 and 172:
The code for this can be found in T
- Page 173 and 174:
Sidebar: Data-Binding Properties of
- Page 175 and 176: Implementing Two-Way Binding To imp
- Page 177 and 178: • oneTime A function that just lo
- Page 179 and 180: • Windows 8 apps have rich stylin
- Page 181 and 182: Collection Control Basics To seek t
- Page 183 and 184: indingList: bindingList, array: arr
- Page 185 and 186: Now while the ListView control in S
- Page 187 and 188: The header template in html/scenari
- Page 189 and 190: In the modified sample I changed na
- Page 191 and 192: } return groupCompareGlobalized(lef
- Page 193 and 194: a function instead of a declarative
- Page 195 and 196: var list = new WinJS.Binding.List()
- Page 197 and 198: data-win-options="{ itemDataSource:
- Page 199 and 200: e used anywhere it’s appropriate,
- Page 201 and 202: If you were to provide your own nav
- Page 203 and 204: sample code in this chapter’s com
- Page 205 and 206: Because of data binding, changes to
- Page 207 and 208: What is does have, however, is this
- Page 209 and 210: What you then do inside the element
- Page 211 and 212: • The groups themselves are all s
- Page 213 and 214: and the current viewable area. Thou
- Page 215 and 216: Styling Following the precedent of
- Page 217 and 218: Technically speaking, the layout pr
- Page 219 and 220: or you can set layout.groupInfo fro
- Page 221 and 222: Using the first item’s dimension
- Page 223 and 224: You can set a breakpoint in this fu
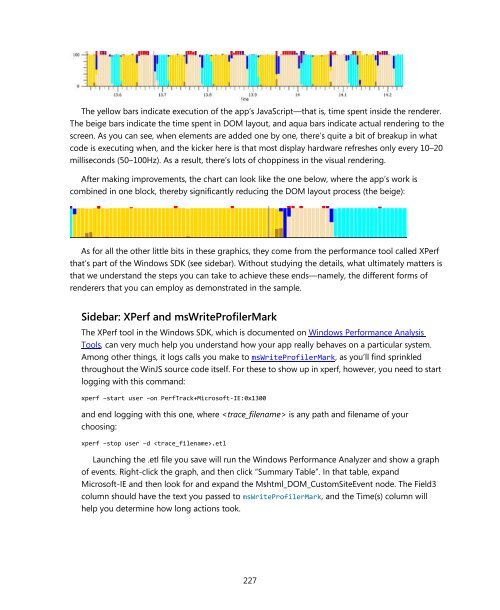
- Page 225: Incremental Loading Apart from pote
- Page 229 and 230: If it’s not provided (as when the
- Page 231 and 232: During initialization (outside the
- Page 233 and 234: Chapter 6 Layout Compared to other
- Page 235 and 236: that appear when needed through app
- Page 237 and 238: Within the body of content, then, W
- Page 239 and 240: } -ms-grid-columns: 120px 2fr 80px
- Page 241 and 242: -ms-scroll-snap-x Shorthand to comb
- Page 243 and 244: WinRT: filled -ms-view-state: fille
- Page 245 and 246: Handling View States As I just ment
- Page 247 and 248: var mql = window.matchMedia("(-ms-v
- Page 249 and 250: individual items in snapped view. B
- Page 251 and 252: FIGURE 6-5 Options for display size
- Page 253 and 254: If your developer sensibilities obj
- Page 255 and 256: Content goes here This is really
- Page 257 and 258: Such a layout is most easily achiev
- Page 259 and 260: Because the specs themselves are st
- Page 261 and 262: /* In CSS */ #divMain { width: 100%
- Page 263 and 264: CSS styles that are supported for W
- Page 265 and 266: Within the activated handler docume
- Page 267 and 268: Multicolumn Elements and Regions Tr
- Page 269 and 270: FIGURE 6-9 CSS region chains to flo
- Page 271 and 272: Chapter 7 Commanding UI For consume
- Page 273 and 274: • Commands that can’t be placed
- Page 275 and 276: which provide many specifics on pla
- Page 277 and 278:
Tip To prevent the app bar from app
- Page 279 and 280:
This example doesn’t provide any
- Page 281 and 282:
var appbar = document.getElementByI
- Page 283 and 284:
• afterhide occurs immediately af
- Page 285 and 286:
This button’s click handler uses
- Page 287 and 288:
In the extraClass properties we’v
- Page 289 and 290:
To provide graphics of your own, do
- Page 291 and 292:
It should come as no surprise by
- Page 293 and 294:
Flyouts and Menus Going back to our
- Page 295 and 296:
are optional with show. (Note also
- Page 297 and 298:
function confirmOrder() { bought =
- Page 299 and 300:
The point of this last example is t
- Page 301 and 302:
Also, go into css/header-menu.c
- Page 303 and 304:
In the contextmenu handler menu.sho
- Page 305 and 306:
Scenario 3 is identical to Scenario
- Page 307 and 308:
The app bar now appears as follows,
- Page 309 and 310:
This message will appear if the use
- Page 311 and 312:
Chapter 8 State, Settings, Files, a
- Page 313 and 314:
while our permanent home was being
- Page 315 and 316:
• Account and profile configurati
- Page 317 and 318:
By the way, you might have some rea
- Page 319 and 320:
var localSettings = Windows.Storage
- Page 321 and 322:
It is also possible to migrate app
- Page 323 and 324:
Tip There are some file extensions
- Page 325 and 326:
Sidebar: Closing Streams vs. Closin
- Page 327 and 328:
Using App Data APIs for State Manag
- Page 329 and 330:
efore setting up new defaults. As m
- Page 331 and 332:
Roaming State The automatic roaming
- Page 333 and 334:
good idea to not be too aggressive
- Page 335 and 336:
Each app-supplied command can do on
- Page 337 and 338:
There are two ways to implement thi
- Page 339 and 340:
function helpCommandInvoked(e) { va
- Page 341 and 342:
Programmatically Invoking Settings
- Page 343 and 344:
Sidebar: Changes to Permissions A c
- Page 345 and 346:
Think about this for a moment (as I
- Page 347 and 348:
eturns an appropriate StorageFile o
- Page 349 and 350:
function pickSinglePhoto() { // Ver
- Page 351 and 352:
When picking multiple files, the re
- Page 353 and 354:
indicate a new filename in which to
- Page 355 and 356:
scenario oriented on the music libr
- Page 357 and 358:
A QueryOptions is generally created
- Page 359 and 360:
The setPropertyPrefetch method goes
- Page 361 and 362:
What We’ve Just Learned • State
- Page 363 and 364:
Chapter 9 Input and Sensors Touch i
- Page 365 and 366:
• Second, when you need to handle
- Page 367 and 368:
One or more fingers touch the scree
- Page 369 and 370:
You might notice a conspicuous abse
- Page 371 and 372:
Note that this method has no effect
- Page 373 and 374:
• TouchCapabilities Properties ar
- Page 375 and 376:
Tip Pointer events won’t fire if
- Page 377 and 378:
Properties Description currentPoint
- Page 379 and 380:
The first step to receiving gesture
- Page 381 and 382:
• MSGestureHold occurs when MSPoi
- Page 383 and 384:
FIGURE 9-3 A conceptual representat
- Page 385 and 386:
FIGURE 9-4 The Input Instantiable G
- Page 387 and 388:
obviously a specific deceleration m
- Page 389 and 390:
• Process keydown, keyup, and key
- Page 391 and 392:
For passwords you get a key to hide
- Page 393 and 394:
keyboard sample. 50 Adding listener
- Page 395 and 396:
Standard Keystrokes The last piece
- Page 397 and 398:
FIGURE 9-9 The Input Ink sample wit
- Page 399 and 400:
(string), and timestamp (Date) prop
- Page 401 and 402:
Like all other WinRT APIs, however,
- Page 403 and 404:
Here’s an example of such code fr
- Page 405 and 406:
Chapter 10 Media To say that media
- Page 407 and 408:
movie.controls = true; document.get
- Page 409 and 410:
declared inline, created dynamicall
- Page 411 and 412:
} document.getElementById("r").styl
- Page 413 and 414:
function onImageError(source) { sou
- Page 415 and 416:
• By copying pixel data from a vi
- Page 417 and 418:
It’s also helpful to understand t
- Page 419 and 420:
Video Element Extension APIs Beyond
- Page 421 and 422:
vid.msInsertVideoEffect("GrayscaleT
- Page 423 and 424:
elements with the same source. The
- Page 425 and 426:
in the background. As a developer,
- Page 427 and 428:
function soundLevelChanged() { //Ca
- Page 429 and 430:
Playing Sequential Audio An app tha
- Page 431 and 432:
need to bypass the audio element an
- Page 433 and 434:
To guarantee the ordering we use Pr
- Page 435 and 436:
Thumbnails First, StorageFile.getTh
- Page 437 and 438:
or combination of System.GPS.Longit
- Page 439 and 440:
} return degrees + "°" + minutes +
- Page 441 and 442:
Most of the displayImageUI function
- Page 443 and 444:
provides a specific BitmapEncoder i
- Page 445 and 446:
method can be called only once and
- Page 447 and 448:
Transcoding and Custom Image Format
- Page 449 and 450:
Transcoding happens either from one
- Page 451 and 452:
In Scenario 2, the sample always us
- Page 453 and 454:
Media Capture There are times when
- Page 455 and 456:
ecordLimitationExceeded Fired when
- Page 457 and 458:
} captureInitSettings.videoDeviceId
- Page 459 and 460:
} // Add the devices to deviceList
- Page 461 and 462:
Streaming from a Server and Digital
- Page 463 and 464:
Here’s how such apps generally wo
- Page 465 and 466:
Next you’ll want to wire up handl
- Page 467 and 468:
• WinRT provides a rich API for m
- Page 469 and 470:
necessary. In this way, excessive a
- Page 471 and 472:
The Control Panel setting can be ob
- Page 473 and 474:
screen; the Panel animations are fo
- Page 475 and 476:
want to chain or synchronize animat
- Page 477 and 478:
Create addToList animation. var add
- Page 479 and 480:
CSS Animations and Transitions As n
- Page 481 and 482:
Animations work in an opposite mann
- Page 483 and 484:
Keyframes, while typically defined
- Page 485 and 486:
FIGURE 11-2 Output of Scenario 3 of
- Page 487 and 488:
What’s more, requestAnimationFram
- Page 489 and 490:
Still, 20% is a lot of CPU power to
- Page 491 and 492:
Chapter 12 Contracts Recently I dis
- Page 493 and 494:
File activation (file type associat
- Page 495 and 496:
more specific. For instance, when a
- Page 497 and 498:
var dataPackageTitle = document.get
- Page 499 and 500:
The other interesting part of Scena
- Page 501 and 502:
When sharing an image, don't forget
- Page 503 and 504:
FIGURE 12-3 The Share content targe
- Page 505 and 506:
• Acknowledge user actions when y
- Page 507 and 508:
The key here is the args.detail.sha
- Page 509 and 510:
target app. If you’re using image
- Page 511 and 512:
FIGURE 12-7 Controls to create a qu
- Page 513 and 514:
The question is how to wire up comm
- Page 515 and 516:
The Search contract that makes this
- Page 517 and 518:
FIGURE 12-11 The Search declaration
- Page 519 and 520:
} } })); In the search activation p
- Page 521 and 522:
} }); Windows.ApplicationModel.Sear
- Page 523 and 524:
The request object also has a getDe
- Page 525 and 526:
Type to Search The final feature of
- Page 527 and 528:
egistered for that type, rather tha
- Page 529 and 530:
At the very bottom of this UI you c
- Page 531 and 532:
ecord a new sound. In such cases, h
- Page 533 and 534:
Activation of a File Picker Provide
- Page 535 and 536:
Windows.ApplicationModel.Activation
- Page 537 and 538:
A final note is that a file picker
- Page 539 and 540:
}; // Create a file to provide back
- Page 541 and 542:
The next step for the provider is t
- Page 543 and 544:
FIGURE 12-18 The provider sample’
- Page 545 and 546:
FIGURE 12-21 The provider sample’
- Page 547 and 548:
• If the UI status is visible, sw
- Page 549 and 550:
Just as the file picker contract al
- Page 551 and 552:
Using the Contact Picker Contacts a
- Page 553 and 554:
} } }); Contact Picker Providers On
- Page 555 and 556:
As you can see, the homeEmail field
- Page 557 and 558:
Chapter 13 Tiles, Notifications, th
- Page 559 and 560:
FIGURE 13-1 The typical default Sta
- Page 561 and 562:
Selecting an item on the Start scre
- Page 563 and 564:
In many ways, live tiles might redu
- Page 565 and 566:
toss up lots of superfluous toast,
- Page 567 and 568:
Yet Windows doesn’t want to force
- Page 569 and 570:
The third way an app can issue upda
- Page 571 and 572:
Providing both square and wide stat
- Page 573 and 574:
• arguments A string that’s pas
- Page 575 and 576:
function activated(eventObject) { i
- Page 577 and 578:
16 or fewer characters that is used
- Page 579 and 580:
Third, if you supply an image that
- Page 581 and 582:
arrive on a Windows 8 machine will
- Page 583 and 584:
The Notifications Extensions Librar
- Page 585 and 586:
The other bits of the manifest that
- Page 587 and 588:
In such cases it would be better to
- Page 589 and 590:
Windows.UI.Notifications.BadgeUpdat
- Page 591 and 592:
you’d use start time), or the pha
- Page 593 and 594:
Tip The tile and badge updaters are
- Page 595 and 596:
eturned from page requests, as we
- Page 597 and 598:
through the Web platform installer.
- Page 599 and 600:
Toast Notifications So far in this
- Page 601 and 602:
FIGURE 13-16 Issuing text toasts th
- Page 603 and 604:
supports addImageQuery for scale, l
- Page 605 and 606:
A scheduled toast is created using
- Page 607 and 608:
To update a tile, set a badge, or i
- Page 609 and 610:
Your app should go through this sho
- Page 611 and 612:
matter of sending an XmlHttpRequest
- Page 613 and 614:
In the running app, the pushnotific
- Page 615 and 616:
Background Tasks and Lock Screen Ap
- Page 617 and 618:
FIGURE 13-18 The manifest editor fo
- Page 619 and 620:
In this code, the BackgroundTaskBui
- Page 621 and 622:
var internetCondition = new backgro
- Page 623 and 624:
The Background task sample provides
- Page 625 and 626:
Note Working with the lock screen i
- Page 627 and 628:
Debugging Background Tasks By this
- Page 629 and 630:
• Periodic updates for tiles and
- Page 631 and 632:
Network Information and Connectivit
- Page 633 and 634:
networkstatuschanged event that we
- Page 635 and 636:
Note Windows Store apps written in
- Page 637 and 638:
Programmatically, as noted before,
- Page 639 and 640:
Although this option will not set u
- Page 641 and 642:
hundred kilobytes—if you know fro
- Page 643 and 644:
Finally, avoid using XHR for large
- Page 645 and 646:
Starting a download transfer happen
- Page 647 and 648:
There is also a variation of create
- Page 649 and 650:
operations—it is possible to crea
- Page 651 and 652:
); "form-data", "------------------
- Page 653 and 654:
Basically, you would change the pol
- Page 655 and 656:
Authentication, Credentials, and th
- Page 657 and 658:
The result from pickAsync, as given
- Page 659 and 660:
To clarify the relationship between
- Page 661 and 662:
There is one subtle difference betw
- Page 663 and 664:
Within the web authentication broke
- Page 665 and 666:
https://www.facebook.com/dialog/oau
- Page 667 and 668:
Single Sign On with Live Connect Be
- Page 669 and 670:
setAccountPicturesAsync (for provid
- Page 671 and 672:
And lastly it’s worth at least li
- Page 673 and 674:
} var scenario1Link = document.getE
- Page 675 and 676:
} return currentFeed.items[currentI
- Page 677 and 678:
When data arrives, the handler rece
- Page 679 and 680:
} // This is a helper function echo
- Page 681 and 682:
On the client side, StreamSocket ag
- Page 683 and 684:
And closing the socket in Scenario
- Page 685 and 686:
In the sample, we first create a Me
- Page 687 and 688:
} try { var size = dataWriter.measu
- Page 689 and 690:
What We’ve Just Learned • Netwo
- Page 691 and 692:
• Connecting with devices in the
- Page 693 and 694:
The XInput and JavaScript controlle
- Page 695 and 696:
function renderLoop() { var state =
- Page 697 and 698:
FIGURE 15-3 Sample device enumerati
- Page 699 and 700:
The Removable Storage sample, in Sc
- Page 701 and 702:
• Communications are supported on
- Page 703 and 704:
Advertising a Connection Making you
- Page 705 and 706:
Tap to Connect and Tap to Activate
- Page 707 and 708:
On a simpler note, publishing a URI
- Page 709 and 710:
FIGURE 15-5 Scenario 2 of the Print
- Page 711 and 712:
Print Document Sources No matter wh
- Page 713 and 714:
If you don’t add a handler for th
- Page 715 and 716:
The final bit to mention in the cod
- Page 717 and 718:
Indeed, when we speak of mixed lang
- Page 719 and 720:
Again, components can also make use
- Page 721 and 722:
Sidebar: WinRT Components vs. Class
- Page 723 and 724:
Once you add the name of a class an
- Page 725 and 726:
With the basic mechanics worked out
- Page 727 and 728:
As we did with C#, let’s start by
- Page 729 and 730:
Comparing the Results The Image Man
- Page 731 and 732:
} return sum; Running a count with
- Page 733 and 734:
Component Implementation • When c
- Page 735 and 736:
When this worker is started, the on
- Page 737 and 738:
FIGURE 16-4 A promise manages and i
- Page 739 and 740:
Note that Task.Run does not support
- Page 741 and 742:
As with C#, there are additional st
- Page 743 and 744:
public IAsyncOperation ConvertPixel
- Page 745 and 746:
method called ConvertGrayscalFileAs
- Page 747 and 748:
Event names, on the other hand, are
- Page 749 and 750:
One challenge, as we saw in the qui
- Page 751 and 752:
The Building your own Windows Runti
- Page 753 and 754:
• Check against an encrypted lice
- Page 755 and 756:
Chapter 17 Apps for Everyone: Acces
- Page 757 and 758:
Your App, Your Business If you chec
- Page 759 and 760:
FIGURE 17-1 Creating an app package
- Page 761 and 762:
desktop applications and distribute
- Page 763 and 764:
means is that if you want to promot
- Page 765 and 766:
You should also strongly consider m
- Page 767 and 768:
• In-app purchases through the Wi
- Page 769 and 770:
That said, WinRT provides for the f
- Page 771 and 772:
When your app accesses CurrentAppSi
- Page 773 and 774:
} }); currentApp.licenseInformation
- Page 775 and 776:
You won’t hit your breakpoint imm
- Page 777 and 778:
If you’re using a custom commerce
- Page 779 and 780:
You might have noticed that a Produ
- Page 781 and 782:
Id=\"e2a62d42-dbca-43d2-b779-66eb91
- Page 783 and 784:
The latter two we’ve already cove
- Page 785 and 786:
• aria-label Directly provides te
- Page 787 and 788:
Apart from the small bits of code i
- Page 789 and 790:
control sample, and switch between
- Page 791 and 792:
Scenario 2 shows similar effects wi
- Page 793 and 794:
Canvas a better choice? To this poi
- Page 795 and 796:
one resource. For a few examples of
- Page 797 and 798:
addition of new string and image re
- Page 799 and 800:
FIGURE 17-9 Control panel dialogs f
- Page 801 and 802:
Formatting Culture-Specific Data an
- Page 803 and 804:
Sorting and Grouping Just as a worl
- Page 805 and 806:
With images, you can reverse them w
- Page 807 and 808:
Note CSS files can contain string l
- Page 809 and 810:
Manifest: Let’s turn now to the m
- Page 811 and 812:
Other affected files in this app in
- Page 813 and 814:
Sidebar: String Resources in Settin
- Page 815 and 816:
the folder name itself doesn’t us
- Page 817 and 818:
If you like, you can just send your
- Page 819 and 820:
FIGURE 17-11 The Multilingual App T
- Page 821 and 822:
Second, the Toolkit will detect if
- Page 823 and 824:
Localization Wrap-Up Well, we’re
- Page 825 and 826:
Let me say that again: all of this
- Page 827 and 828:
Onboarding and Working through Reje
- Page 829 and 830:
Connecting Your Website If you have
- Page 831 and 832:
What We’ve Just Learned • An ap
- Page 833:
What do you think of this book? We