CP4192 ANNUAL REPORT 2016_lowres_final

Create successful ePaper yourself
Turn your PDF publications into a flip-book with our unique Google optimized e-Paper software.
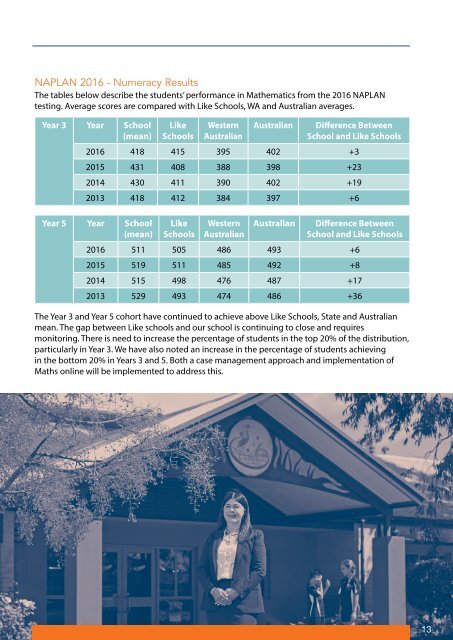
NAPLAN <strong>2016</strong> - Numeracy Results<br />
The tables below describe the students’ performance in Mathematics from the <strong>2016</strong> NAPLAN<br />
testing. Average scores are compared with Like Schools, WA and Australian averages.<br />
Year 3 Year School<br />
(mean)<br />
Like<br />
Schools<br />
Western<br />
Australian<br />
Australian<br />
Difference Between<br />
School and Like Schools<br />
<strong>2016</strong> 418 415 395 402 +3<br />
2015 431 408 388 398 +23<br />
2014 430 411 390 402 +19<br />
2013 418 412 384 397 +6<br />
Year 5 Year School<br />
(mean)<br />
Like<br />
Schools<br />
Western<br />
Australian<br />
Australian<br />
Difference Between<br />
School and Like Schools<br />
<strong>2016</strong> 511 505 486 493 +6<br />
2015 519 511 485 492 +8<br />
2014 515 498 476 487 +17<br />
2013 529 493 474 486 +36<br />
The Year 3 and Year 5 cohort have continued to achieve above Like Schools, State and Australian<br />
mean. The gap between Like schools and our school is continuing to close and requires<br />
monitoring. There is need to increase the percentage of students in the top 20% of the distribution,<br />
particularly in Year 3. We have also noted an increase in the percentage of students achieving<br />
in the bottom 20% in Years 3 and 5. Both a case management approach and implementation of<br />
Maths online will be implemented to address this.<br />
13