CP4192 ANNUAL REPORT 2016_lowres_final

Create successful ePaper yourself
Turn your PDF publications into a flip-book with our unique Google optimized e-Paper software.
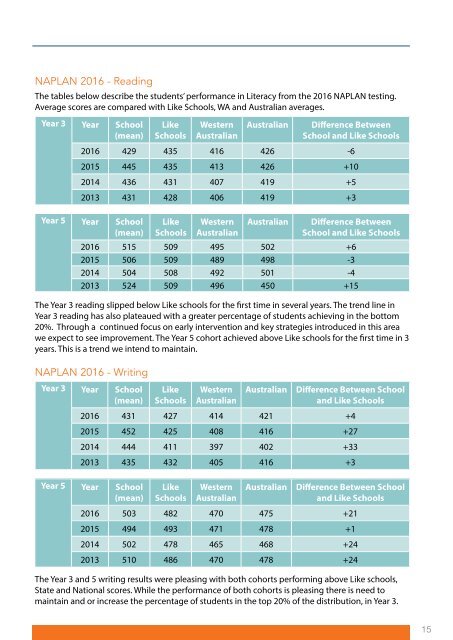
NAPLAN <strong>2016</strong> - Reading<br />
The tables below describe the students’ performance in Literacy from the <strong>2016</strong> NAPLAN testing.<br />
Average scores are compared with Like Schools, WA and Australian averages.<br />
Year 3 Year School<br />
(mean)<br />
Like<br />
Schools<br />
Western<br />
Australian<br />
Australian<br />
Difference Between<br />
School and Like Schools<br />
<strong>2016</strong> 429 435 416 426 -6<br />
2015 445 435 413 426 +10<br />
2014 436 431 407 419 +5<br />
2013 431 428 406 419 +3<br />
Year 5 Year School<br />
(mean)<br />
Like<br />
Schools<br />
Western<br />
Australian<br />
Australian<br />
Difference Between<br />
School and Like Schools<br />
<strong>2016</strong> 515 509 495 502 +6<br />
2015 506 509 489 498 -3<br />
2014 504 508 492 501 -4<br />
2013 524 509 496 450 +15<br />
The Year 3 reading slipped below Like schools for the first time in several years. The trend line in<br />
Year 3 reading has also plateaued with a greater percentage of students achieving in the bottom<br />
20%. Through a continued focus on early intervention and key strategies introduced in this area<br />
we expect to see improvement. The Year 5 cohort achieved above Like schools for the first time in 3<br />
years. This is a trend we intend to maintain.<br />
NAPLAN <strong>2016</strong> - Writing<br />
Year 3 Year School<br />
(mean)<br />
Like<br />
Schools<br />
Western<br />
Australian<br />
Australian<br />
Difference Between School<br />
and Like Schools<br />
<strong>2016</strong> 431 427 414 421 +4<br />
2015 452 425 408 416 +27<br />
2014 444 411 397 402 +33<br />
2013 435 432 405 416 +3<br />
Year 5 Year School<br />
(mean)<br />
Like<br />
Schools<br />
Western<br />
Australian<br />
Australian<br />
Difference Between School<br />
and Like Schools<br />
<strong>2016</strong> 503 482 470 475 +21<br />
2015 494 493 471 478 +1<br />
2014 502 478 465 468 +24<br />
2013 510 486 470 478 +24<br />
The Year 3 and 5 writing results were pleasing with both cohorts performing above Like schools,<br />
State and National scores. While the performance of both cohorts is pleasing there is need to<br />
maintain and or increase the percentage of students in the top 20% of the distribution, in Year 3.<br />
15