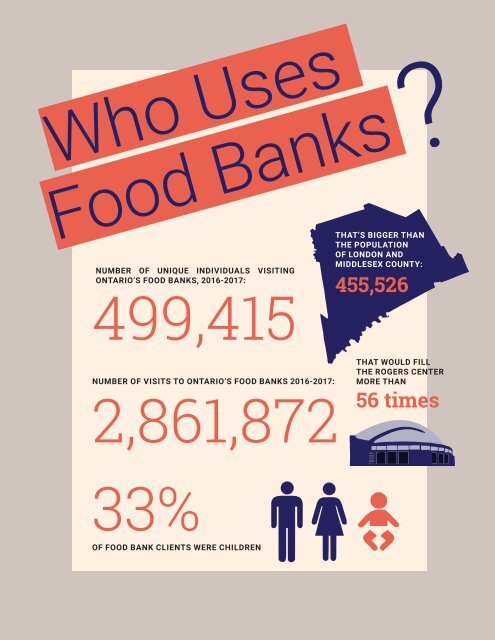
Who Uses Banks? Food NUMBER OF UNIQUE INDIVIDUALS VISITING ONTARIO’S FOOD BANKS, 2016-<str<strong>on</strong>g>2017</str<strong>on</strong>g>: 499,415 THAT’S BIGGER THAN THE POPULATION OF LONDON AND MIDDLESEX COUNTY: 455,526 NUMBER OF VISITS TO ONTARIO’S FOOD BANKS 2016-<str<strong>on</strong>g>2017</str<strong>on</strong>g>: 2,861,872 THAT WOULD FILL THE ROGERS CENTER MORE THAN 56 times 33% OF FOOD BANK CLIENTS WERE CHILDREN
here are a number <str<strong>on</strong>g>of</str<strong>on</strong>g> misc<strong>on</strong>cepti<strong>on</strong>s related to who it is that vis<str<strong>on</strong>g>its</str<strong>on</strong>g> food banks, how <str<strong>on</strong>g>of</str<strong>on</strong>g>ten they access these services, <str<strong>on</strong>g>and</str<strong>on</strong>g> what brought them there <strong>in</strong>itially. However, the reality is that these <strong>in</strong>dividuals are hardwork<strong>in</strong>g families, Tadults liv<strong>in</strong>g with a disability, children, <str<strong>on</strong>g>and</str<strong>on</strong>g> senior citizens – people who simply do not have the means to afford their most basic necessities. More <str<strong>on</strong>g>of</str<strong>on</strong>g>ten than not, food banks are visited <strong>on</strong> a temporary basis by <strong>in</strong>dividuals requir<strong>in</strong>g emergency food support. Over the last year, 29 per cent <str<strong>on</strong>g>of</str<strong>on</strong>g> all food bank clients accessed food bank services <strong>on</strong>ly <strong>on</strong>ce, <str<strong>on</strong>g>and</str<strong>on</strong>g> over 50 per cent <str<strong>on</strong>g>of</str<strong>on</strong>g> clients visited three times or less. <str<strong>on</strong>g>The</str<strong>on</strong>g> total number <str<strong>on</strong>g>of</str<strong>on</strong>g> vis<str<strong>on</strong>g>its</str<strong>on</strong>g> to food banks each m<strong>on</strong>th, however, rema<strong>in</strong>ed relatively c<strong>on</strong>sistent with an average <str<strong>on</strong>g>of</str<strong>on</strong>g> 238,497 vis<str<strong>on</strong>g>its</str<strong>on</strong>g> per m<strong>on</strong>th, network-wide. What this means is that, every m<strong>on</strong>th, there are hundreds <str<strong>on</strong>g>of</str<strong>on</strong>g> thous<str<strong>on</strong>g>and</str<strong>on</strong>g>s <str<strong>on</strong>g>of</str<strong>on</strong>g> adults, seniors <str<strong>on</strong>g>and</str<strong>on</strong>g> families that are walk<strong>in</strong>g a very f<strong>in</strong>e l<strong>in</strong>e between just barely surviv<strong>in</strong>g <str<strong>on</strong>g>and</str<strong>on</strong>g> fall<strong>in</strong>g <strong>in</strong>to the deepest levels <str<strong>on</strong>g>of</str<strong>on</strong>g> poverty. FIGURE 1.1: NUMBER OF TIMES FOOD BANK CLIENTS VISIT PER YEAR 35% 30% 25% 20% 15% 10% 5% 0% FIGURE 1.2: VISITS TO FOOD BANKS, PER MONTH 300,000 250,000 200,000 150,000 100,000 50,000 0 April May June July August Sept Oct Nov Dec Jan Feb Mar 5