

low

Create successful ePaper yourself
Turn your PDF publications into a flip-book with our unique Google optimized e-Paper software.
Background<br />
As it was introduced on opening part of this<br />
section, monitoring of IOR/EOR projects<br />
is being considered necessary to guide and<br />
guarantee the success of these projects. In lack of<br />
a proper monitoring program, the fate of injected<br />
material would be unknown with high risk of<br />
injected material (e.g., CO 2<br />
, Methane, Polymer,<br />
Modified water) to be migrated to another layer.<br />
There have recently been introduced variety of<br />
monitoring programs, however, 4D seismic, due<br />
to its full and 3 dimensional coverage of reservoir,<br />
is being considered as the main monitoring<br />
program. Utilising 3D and 4D seismic data,<br />
international oil and gas companies have improved<br />
the reservoir recovery factor in North Sea above<br />
30% and reaching at around 60% [1] . By measuring<br />
the water and gas fronts and pressure variation<br />
in the reservoir as well as by identifying bypassed<br />
oil and gas, it has been successfully used on most<br />
of IOR/EOR projects on the North Sea reservoirs<br />
to optimise IOR/EOR projects, well placement<br />
and production/injection plans. On the other<br />
hand, most of failed injection projects have been<br />
typically suffering from lack of comprehensive<br />
monitoring programs.<br />
What Does Seismic Data Offer to<br />
Us?<br />
Seismic data contains quantitative and valuable<br />
information that has widely been used<br />
during reservoir exploration, development,<br />
production and monitoring steps. Quantitative<br />
seismic interpretation such as rock physics,<br />
AVO modelling, inversion and geomechanics is<br />
normally ended up with extracting reservoir static<br />
parameters such as porosity, shale content and<br />
oil and gas saturation from the seismic data. 4D<br />
seismic, which is a series of repeated 3D seismic<br />
surveys over time, has been extensively used<br />
by oil and gas companies to monitor reservoir<br />
production and injection in time and space. The<br />
elastic and acoustic parameters of fluid and rock<br />
changes by production activities, and this affects<br />
the reflection coefficients at the top as well as at<br />
the base of reservoir. These changes are detected<br />
by amplitude changes in different angles,<br />
timeshift or even frequency-derived attributes<br />
(Figure 1). 4D seismic has the potential to provide<br />
information regarding fluid movements, pressure<br />
changes, reservoir compaction, barriers and<br />
compartments, fault transmissibility and general<br />
connectivity.<br />
These information assist to optimise IOR/<br />
EOR projects in the filed scale, improve well<br />
performance and possibly increase a field’s<br />
economic life. Time lapse seismic applicability has<br />
been proven for monitoring of gas injection for the<br />
storage purposes, water injection and managing<br />
the gas coming out of solution. It has also been<br />
used in monitoring of heavy oil reservoirs, gas<br />
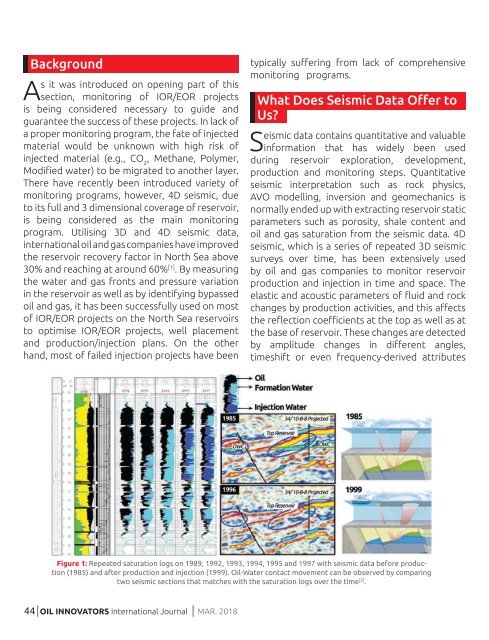
injection and gas reservoir production [3] . Figure<br />
1 shows repeated saturation logs on 1989, 1992,<br />
1993, 1994, 1995 and 1997 on Gullfaks field<br />
(North Sea). It also shows seismic data on 1985<br />
(before production) and 1999 after production<br />
and injection. Utilising Rock Physics analysis, top<br />
of oil bearing sandstone is represented by yel<strong>low</strong><br />
colour on the seismic sections. As it can be seen<br />
from Figure 1, yel<strong>low</strong> colour signal disappears<br />
once it reaches at oil-water contact. OWC<br />
movement can be observed on both well logs<br />
and seismic data that matches with the animated<br />
figures on the right hand side.<br />
The Selected Case Studies<br />
In this brief article, there are presented a few<br />
successful examples from the literature. The<br />
first example (Figure 2) is from North Sea. Halfdan<br />
reservoir is a Carbonate (Chalk) oil reservoir that is<br />
under FAST (Fracture Aligned Sweep Technology)<br />
production method [1] . Horizontal wells produces<br />
for 6 months until it is converted to the water<br />
injection well. Water front is monitored by 4D<br />
seismic data. Water replaced by oil presents<br />
hardening signal (increase in acoustic impedance)<br />
on the 4D seismic maps that is shown by blue<br />
colour on Figure 2-a and b. A highlighted area<br />
is shown on d and e for better visualisations. As<br />
an example, the water front around the injector<br />
well (dashed blue line) is presented on 2005-1992<br />
maps (a and d). Water front movement towards<br />
production wells (green lines) can be detected on<br />
2012 on b and e maps. White colour represents unswept<br />
oil in these figures. Figure 2-c and f shows<br />
2012-2005 to understand the water movement<br />
over time in one map. Red colour signals on these<br />
maps represent the softening signal (decrease in<br />
Figure 1: Repeated saturation logs on 1989, 1992, 1993, 1994, 1995 and 1997 with seismic data before production<br />
(1985) and after production and injection (1999). Oil-Water contact movement can be observed by comparing<br />
two seismic sections that matches with the saturation logs over the time [2] .<br />
Figure 2: 4D seismic maps on 2005-1992, 2012-1992 and 2012-2005 on Halfdan oil field. The bottom figure shows<br />
the selected area in detail. Blue colour represents the hardening 4D seismic signal that is due to oil replacing by<br />
water. On the other hand, red colour signal represents the oil replacing by gas due to gas coming out of solution<br />
mainly on the northern parts in which pressure goes be<strong>low</strong> bubble point pressure. Production and injection wells<br />
re shown by green and dashed blue lines [1] .<br />
44 OIL INNOVATORS International Journal MAR. 2018 45