Hyder Consulting PLC Annual Report 2012
Hyder Consulting PLC Annual Report 2012
Hyder Consulting PLC Annual Report 2012

You also want an ePaper? Increase the reach of your titles
YUMPU automatically turns print PDFs into web optimized ePapers that Google loves.
Financial Review<br />
The group’s geographic diversity has enabled us to report<br />
another good set of financial results, in what have been<br />
mixed market conditions. Our Australian business has<br />
continued to perform well and benefited from the strength<br />
of the Australian dollar. In the Middle East our results have<br />
improved as new projects have been secured, following<br />
our investments in Qatar and Saudi Arabia. The UK, and<br />
particularly the highways sector has been challenging,<br />
however our results have held up well and we are now well<br />
positioned for the year ahead.<br />
Cash balances have improved in spite of the current liquidity<br />
pressures, and more onerous payment terms that exist<br />
with public sector clients in the Middle East, where we<br />
are growing. At the year end our net cash balances were<br />
£15.6m, up from £13.1m the year before.<br />
Revenue and profit<br />
Revenue for the year was £277.3m (2011: £290.3m), 4.5%<br />
lower. Net revenue, after deduction of sub-consultant<br />
costs, was 3.8% lower at £241.8m (2011: £251.4m). On a<br />
constant currency basis revenue and net revenue decreased<br />
by 6.1% and 5.5% respectively. The reduction in revenue is<br />
principally due to the challenging market conditions in the<br />
UK, and particularly the highways market.<br />
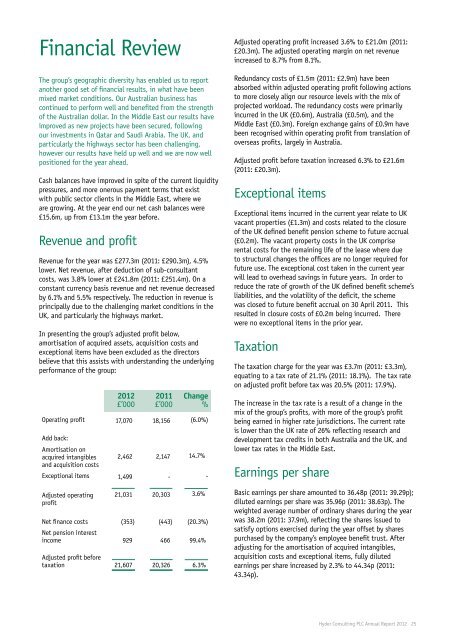
In presenting the group’s adjusted profit below,<br />
amortisation of acquired assets, acquisition costs and<br />
exceptional items have been excluded as the directors<br />
believe that this assists with understanding the underlying<br />
performance of the group:<br />
<strong>2012</strong><br />
£’000<br />
2011<br />
£’000<br />
Change<br />
%<br />
Operating profit 17,070 18,156 (6.0%)<br />
Add back:<br />
Amortisation on<br />
acquired intangibles<br />
and acquisition costs<br />
2,462 2,147 14.7%<br />
Exceptional items 1,499 - -<br />
Adjusted operating<br />
profit<br />
21,031 20,303 3.6%<br />
Net finance costs<br />
Net pension interest<br />
(353) (443) (20.3%)<br />
income 929 466 99.4%<br />
Adjusted profit before<br />
taxation 21,607 20,326 6.3%<br />
Adjusted operating profit increased 3.6% to £21.0m (2011:<br />
£20.3m). The adjusted operating margin on net revenue<br />
increased to 8.7% from 8.1%.<br />
Redundancy costs of £1.5m (2011: £2.9m) have been<br />
absorbed within adjusted operating profit following actions<br />
to more closely align our resource levels with the mix of<br />
projected workload. The redundancy costs were primarily<br />
incurred in the UK (£0.6m), Australia (£0.5m), and the<br />
Middle East (£0.3m). Foreign exchange gains of £0.9m have<br />
been recognised within operating profit from translation of<br />
overseas profits, largely in Australia.<br />
Adjusted profit before taxation increased 6.3% to £21.6m<br />
(2011: £20.3m).<br />
Exceptional items<br />
Exceptional items incurred in the current year relate to UK<br />
vacant properties (£1.3m) and costs related to the closure<br />
of the UK defined benefit pension scheme to future accrual<br />
(£0.2m). The vacant property costs in the UK comprise<br />
rental costs for the remaining life of the lease where due<br />
to structural changes the offices are no longer required for<br />
future use. The exceptional cost taken in the current year<br />
will lead to overhead savings in future years. In order to<br />
reduce the rate of growth of the UK defined benefit scheme’s<br />
liabilities, and the volatility of the deficit, the scheme<br />
was closed to future benefit accrual on 30 April 2011. This<br />
resulted in closure costs of £0.2m being incurred. There<br />
were no exceptional items in the prior year.<br />
Taxation<br />
The taxation charge for the year was £3.7m (2011: £3.3m),<br />
equating to a tax rate of 21.1% (2011: 18.1%). The tax rate<br />
on adjusted profit before tax was 20.5% (2011: 17.9%).<br />
The increase in the tax rate is a result of a change in the<br />
mix of the group’s profits, with more of the group’s profit<br />
being earned in higher rate jurisdictions. The current rate<br />
is lower than the UK rate of 26% reflecting research and<br />
development tax credits in both Australia and the UK, and<br />
lower tax rates in the Middle East.<br />
Earnings per share<br />
Basic earnings per share amounted to 36.48p (2011: 39.29p);<br />
diluted earnings per share was 35.96p (2011: 38.63p). The<br />
weighted average number of ordinary shares during the year<br />
was 38.2m (2011: 37.9m), reflecting the shares issued to<br />
satisfy options exercised during the year offset by shares<br />
purchased by the company’s employee benefit trust. After<br />
adjusting for the amortisation of acquired intangibles,<br />
acquisition costs and exceptional items, fully diluted<br />
earnings per share increased by 2.3% to 44.34p (2011:<br />
43.34p).<br />
<strong>Hyder</strong> <strong>Consulting</strong> <strong>PLC</strong> <strong>Annual</strong> <strong>Report</strong> <strong>2012</strong> 25