THE DESCARTES SYSTEMS GROUP INC.
THE DESCARTES SYSTEMS GROUP INC.
THE DESCARTES SYSTEMS GROUP INC.
You also want an ePaper? Increase the reach of your titles
YUMPU automatically turns print PDFs into web optimized ePapers that Google loves.
These increases were partially offset by the unfavourable impact of foreign exchange rates for the translation of<br />
revenues earned in euros as compared to 2010.<br />
The increase in 2010 as compared to 2009 was primarily due to the acquisition of Belgian-based Dexx in October<br />
2008. This increase was partially offset by the unfavourable impact of foreign exchange rates for the translation of<br />
revenues earned in euros as compared to 2009.<br />
Revenues from the EMEA region, excluding Belgium, were $19.1 million, $14.2 million and $16.3 million in<br />
2011, 2010 and 2009, respectively. The increase in 2011 was primarily due to the acquisitions of Porthus and<br />
Routing International. These increases were partially offset by the unfavourable impact of foreign exchange rates<br />
for the translation of revenues earned in euros as compared to 2010.<br />
The decrease in 2010 as compared to 2009 was due to lower transactional revenues from the GLN in part due to<br />
lower shipping volumes and also lower revenues in 2010 due to the translation of foreign currency revenues at<br />
less favourable foreign exchange rates. This decrease was partially offset by the inclusion of revenues from Dexx.<br />
Revenues from the Asia Pacific region were $3.5 million, $3.6 million and $3.4 million in 2011, 2010 and 2009,<br />
respectively. The decrease in 2011 as compared to 2010 was principally due to lower license revenues.<br />
The increase in 2010 as compared to 2009 was primarily due to the inclusion of a full year of revenue from Dexx<br />
in 2010. This increase was partially offset by lower professional services revenues in 2010 related to the licensing<br />
of our routing solution as well as lower transactional revenues from the GLN in part due to lower global shipping<br />
volumes.<br />
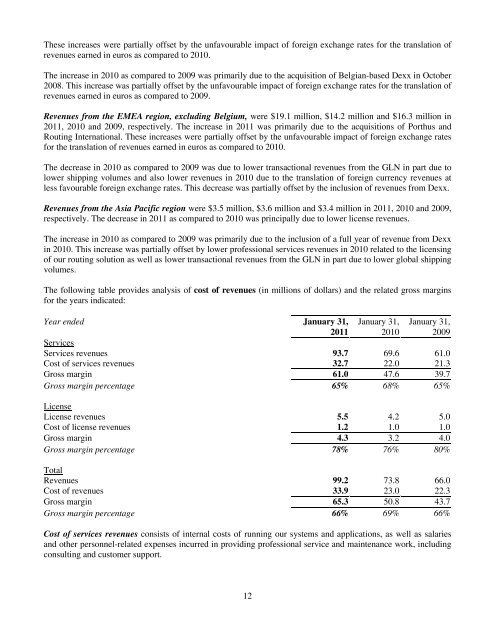
The following table provides analysis of cost of revenues (in millions of dollars) and the related gross margins<br />
for the years indicated:<br />
Year ended January 31, January 31, January 31,<br />
2011 2010 2009<br />
Services<br />
Services revenues 93.7 69.6 61.0<br />
Cost of services revenues 32.7 22.0 21.3<br />
Gross margin 61.0 47.6 39.7<br />
Gross margin percentage 65% 68% 65%<br />
License<br />
License revenues 5.5 4.2 5.0<br />
Cost of license revenues 1.2 1.0 1.0<br />
Gross margin 4.3 3.2 4.0<br />
Gross margin percentage 78% 76% 80%<br />
Total<br />
Revenues 99.2 73.8 66.0<br />
Cost of revenues 33.9 23.0 22.3<br />
Gross margin 65.3 50.8 43.7<br />
Gross margin percentage 66% 69% 66%<br />
Cost of services revenues consists of internal costs of running our systems and applications, as well as salaries<br />
and other personnel-related expenses incurred in providing professional service and maintenance work, including<br />
consulting and customer support.<br />
12


