THE DESCARTES SYSTEMS GROUP INC.
THE DESCARTES SYSTEMS GROUP INC.
THE DESCARTES SYSTEMS GROUP INC.

Create successful ePaper yourself
Turn your PDF publications into a flip-book with our unique Google optimized e-Paper software.
Swedish operations, and only a partial valuation allowance against the deferred tax assets of our Canadian,<br />
Netherlands and United Kingdom operations.<br />
A net deferred tax asset of $37.9 million is recorded on our 2011 consolidated balance sheet for tax benefits that<br />
we currently expect to realize in future years. We have provided a valuation allowance of $32.6 million in 2011<br />
for the amount of tax benefits that are not currently expected to be realized. In determining the valuation<br />
allowance, we considered various factors by taxing jurisdiction, including our currently estimated taxable income<br />
over future periods, our history of losses for tax purposes, our tax planning strategies and the likelihood of success<br />
of our tax filing positions, among others. A change to any of these factors could impact the estimated valuation<br />
allowance and, as a consequence, result in an increase (recovery) or decrease (expense) to the deferred tax assets<br />
recorded on our consolidated balance sheets.<br />
Overall, we generated net income of $11.5 million, $14.3 million and $20.2 million in 2011, 2010 and 2009,<br />
respectively. The $2.8 million decrease in 2011 from 2010 was primarily a result of a $6.3 million increase in<br />
operating expenses, a $4.6 million increase in amortization of intangible assets, a $4.0 million decrease in income<br />
tax recovery, a $2.3 million increase in other charges and a $0.1 million decrease in investment income. Partially<br />
offsetting these decreases was a $14.5 million increase in gross margin.<br />
The $5.9 million decrease in 2010 from 2009 was primarily a result of a $6.4 million increase in operating<br />
expenses, a $3.9 million decrease in income tax recovery, a $1.7 million increase in amortization of intangible<br />
assets, a $1.1 million increase in other charges and a $0.7 million decrease in investment income. Partially<br />
offsetting these decreases was a $7.1 million increase in gross margin and a $0.8 million reduction in contingent<br />
acquisition consideration expensed in 2010 from 2009.<br />
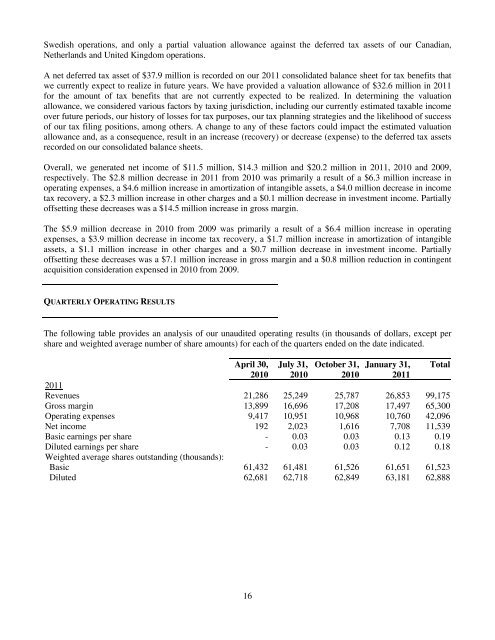
QUARTERLY OPERATING RESULTS<br />
The following table provides an analysis of our unaudited operating results (in thousands of dollars, except per<br />
share and weighted average number of share amounts) for each of the quarters ended on the date indicated.<br />
April 30, July 31, October 31, January 31, Total<br />
2010 2010 2010 2011<br />
2011<br />
Revenues 21,286 25,249 25,787 26,853 99,175<br />
Gross margin 13,899 16,696 17,208 17,497 65,300<br />
Operating expenses 9,417 10,951 10,968 10,760 42,096<br />
Net income 192 2,023 1,616 7,708 11,539<br />
Basic earnings per share - 0.03 0.03 0.13 0.19<br />
Diluted earnings per share<br />
Weighted average shares outstanding (thousands):<br />
- 0.03 0.03 0.12 0.18<br />
Basic 61,432 61,481 61,526 61,651 61,523<br />
Diluted 62,681 62,718 62,849 63,181 62,888<br />
16