Create successful ePaper yourself
Turn your PDF publications into a flip-book with our unique Google optimized e-Paper software.
6.10 Analyzing and documenting observations<br />
Analysis of observation data is similar to that of interviews and focus groups.<br />
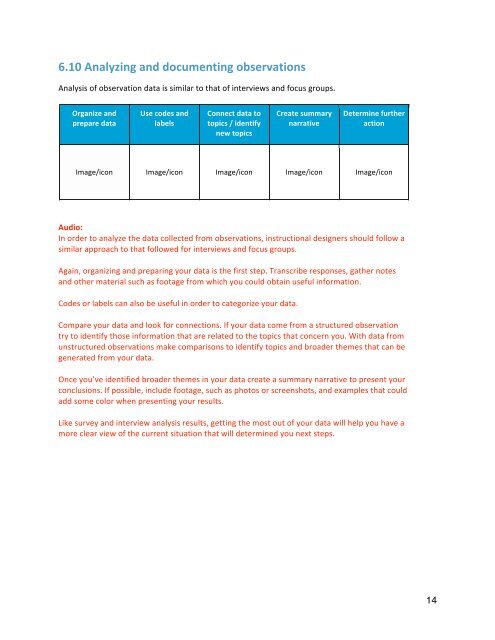
Organize and<br />
prepare data<br />
Use codes and<br />
labels<br />
Connect data to<br />
topics / identify<br />
new topics<br />
Create summary<br />
narrative<br />
Determine further<br />
action<br />
Image/icon Image/icon Image/icon Image/icon Image/icon<br />
Audio:<br />
In order to analyze the data collected from observations, instructional designers should follow a<br />
similar approach to that followed for interviews and focus groups.<br />
Again, organizing and preparing your data is the first step. Transcribe responses, gather notes<br />
and other material such as footage from which you could obtain useful information.<br />
Codes or labels can also be useful in order to categorize your data.<br />
Compare your data and look for connections. If your data come from a structured observation<br />
try to identify those information that are related to the topics that concern you. With data from<br />
unstructured observations make comparisons to identify topics and broader themes that can be<br />
generated from your data.<br />
Once you’ve identified broader themes in your data create a summary narrative to present your<br />
conclusions. If possible, include footage, such as photos or screenshots, and examples that could<br />
add some color when presenting your results.<br />
Like survey and interview analysis results, getting the most out of your data will help you have a<br />
more clear view of the current situation that will determined you next steps.<br />
14


