Blueprint Germany - Öko-Institut eV
Blueprint Germany - Öko-Institut eV
Blueprint Germany - Öko-Institut eV

You also want an ePaper? Increase the reach of your titles
YUMPU automatically turns print PDFs into web optimized ePapers that Google loves.
12<br />
13<br />
in bn €<br />
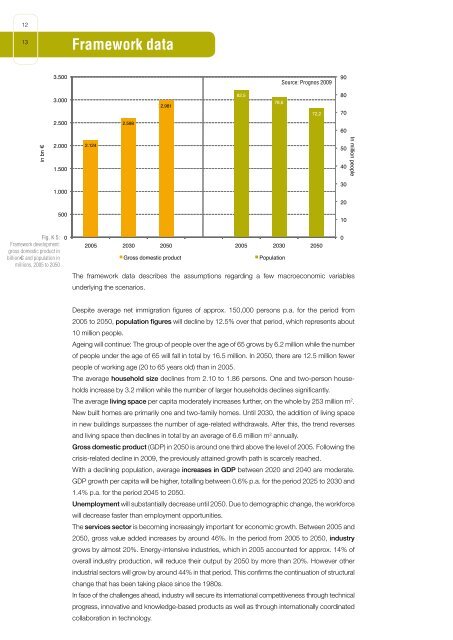
Fig. K 5:<br />
Framework development:<br />
gross domestic product in<br />
billion€ and population in<br />
millions, 2005 to 2050<br />
Framework data<br />
3.500 90<br />
Source: Prognos 2009<br />
3.000<br />
2.500<br />
2.000<br />
1.500<br />
1.000<br />
500<br />
0<br />
2.124<br />
2005<br />
2.598<br />
2.981,0 2.981<br />
The framework data Bruttoinlandsprodukt describes the assumptions regarding a Bevölkerung few macroeconomic variables<br />
underlying the scenarios.<br />
Gross domestic product<br />
Despite average net immigration figures of approx. 150,000 persons p.a. for the period from<br />
2005 to 2050, population figures will decline by 12.5% over that period, which represents about<br />
10 million people.<br />
Ageing will continue: The group of people over the age of 65 grows by 6.2 million while the number<br />
of people under the age of 65 will fall in total by 16.5 million. In 2050, there are 12.5 million fewer<br />
people of working age (20 to 65 years old) than in 2005.<br />
The average household size declines from 2.10 to 1.86 persons. One and two-person households<br />
increase by 3.2 million while the number of larger households declines significantly.<br />
The average living space per capita moderately increases further, on the whole by 253 million m2 .<br />
New built homes are primarily one and two-family homes. Until 2030, the addition of living space<br />
in new buildings surpasses the number of age-related withdrawals. After this, the trend reverses<br />
and living space then declines in total by an average of 6.6 million m2 annually.<br />
Gross domestic product (GDP) in 2050 is around one third above the level of 2005. Following the<br />
crisis-related decline in 2009, the previously attained growth path is scarcely reached.<br />
With a declining population, average increases in GDP between 2020 and 2040 are moderate.<br />
GDP growth per capita will be higher, totalling between 0.6% p.a. for the period 2025 to 2030 and<br />
1.4% p.a. for the period 2045 to 2050.<br />
Unemployment will substantially decrease until 2050. Due to demographic change, the workforce<br />
will decrease faster than employment opportunities.<br />
The services sector is becoming increasingly important for economic growth. Between 2005 and<br />
2050, gross value added increases by around 46%. In the period from 2005 to 2050, industry<br />
grows by almost 20%. Energy-intensive industries, which in 2005 accounted for approx. 14% of<br />
overall industry production, will reduce their output by 2050 by more than 20%. However other<br />
industrial sectors will grow by around 44% in that period. This confirms the continuation of structural<br />
change that has been taking place since the 1980s.<br />
In face of the challenges ahead, industry will secure its international competitiveness through technical<br />
progress, innovative and knowledge-based products as well as through internationally coordinated<br />
collaboration in technology.<br />
82,5<br />
78,6<br />
72,2<br />
2030 2050 2005 2030 2050<br />
Population<br />
80<br />
70<br />
60<br />
50<br />
40<br />
30<br />
20<br />
10<br />
0<br />
In million people