Blueprint Germany - Öko-Institut eV
Blueprint Germany - Öko-Institut eV
Blueprint Germany - Öko-Institut eV

Create successful ePaper yourself
Turn your PDF publications into a flip-book with our unique Google optimized e-Paper software.
6<br />
7<br />
Million tonnes of CO 2 equivalents<br />
1.400<br />
1.200<br />
1.000<br />
Fig. K 3:<br />
Total greenhouse gas<br />
emissions 1990-2050<br />
800<br />
600<br />
400<br />
200<br />
0<br />
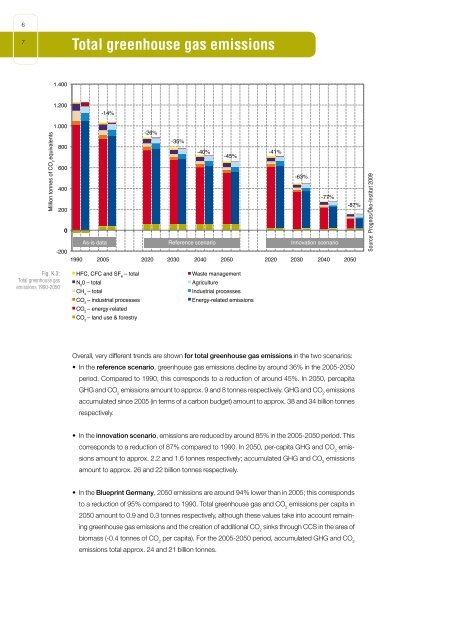
Total greenhouse gas emissions<br />
-14%<br />
-26%<br />
-35%<br />
-40%<br />
-200<br />
1990 2005 2020 2030 2040 2050 2020 2030 2040 2050<br />
HFC, CFC and SF 6 – total Waste management<br />
Overall, very different trends are shown for total greenhouse gas emissions in the two scenarios:<br />
• In the reference scenario, greenhouse gas emissions decline by around 36% in the 2005-2050<br />
period. Compared to 1990, this corresponds to a reduction of around 45%. In 2050, percapita<br />
GHG and CO emissions amount to approx. 9 and 8 tonnes respectively. GHG and CO emissions<br />
2 2<br />
accumulated since 2005 (in terms of a carbon budget) amount to approx. 38 and 34 billion tonnes<br />
respectively.<br />
• In the innovation scenario, emissions are reduced by around 85% in the 2005-2050 period. This<br />
corresponds to a reduction of 87% compared to 1990. In 2050, per-capita GHG and CO 2 emis-<br />
sions amount to approx. 2.2 and 1.6 tonnes respectively; accumulated GHG and CO 2 emissions<br />
amount to approx. 26 and 22 billion tonnes respectively.<br />
• In the <strong>Blueprint</strong> <strong>Germany</strong>, 2050 emissions are around 94% lower than in 2005; this corresponds<br />
to a reduction of 95% compared to 1990. Total greenhouse gas and CO 2 emissions per capita in<br />
2050 amount to 0.9 and 0.3 tonnes respectively, although these values take into account remain-<br />
ing greenhouse gas emissions and the creation of additional CO 2 sinks through CCS in the area of<br />
biomass (-0.4 tonnes of CO 2 per capita). For the 2005-2050 period, accumulated GHG and CO 2<br />
emissions total approx. 24 and 21 billion tonnes.<br />
-45%<br />
-41%<br />
-63%<br />
-77%<br />
As-is data Reference scenario Innovation scenario<br />
N 2 0 – total Agriculture<br />
CH 4 – total Industrial processes<br />
CO 2 – industrial processes Energy-related emissions<br />
CO 2 – energy-related<br />
CO 2 – land use & forestry<br />
-87%<br />
Source: Prognos/<strong>Öko</strong>-<strong>Institut</strong> 2009