Blueprint Germany - Öko-Institut eV
Blueprint Germany - Öko-Institut eV
Blueprint Germany - Öko-Institut eV
Create successful ePaper yourself
Turn your PDF publications into a flip-book with our unique Google optimized e-Paper software.
34<br />
35 List of figures<br />
4<br />
5<br />
6<br />
8<br />
12<br />
14<br />
16<br />
17<br />
18<br />
19<br />
20<br />
21<br />
21<br />
23<br />
24<br />
24<br />
25<br />
26<br />
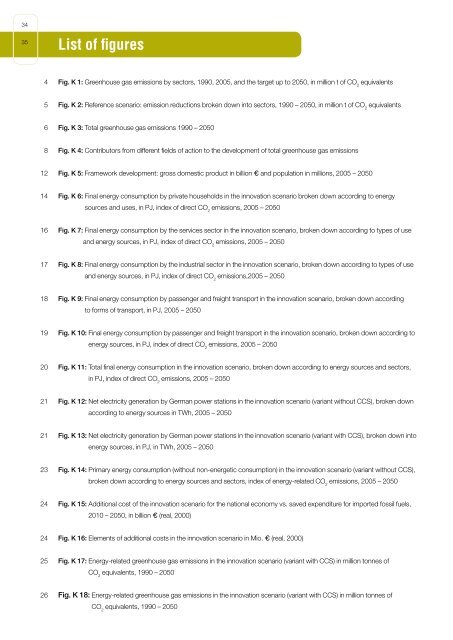
Fig. K 1: Greenhouse gas emissions by sectors, 1990, 2005, and the target up to 2050, in million t of CO 2 equivalents<br />
Fig. K 2: Reference scenario: emission reductions broken down into sectors, 1990 – 2050, in million t of CO 2 equivalents<br />
Fig. K 3: Total greenhouse gas emissions 1990 – 2050<br />
Fig. K 4: Contributors from different fields of action to the development of total greenhouse gas emissions<br />
Fig. K 5: Framework development: gross domestic product in billion € and population in millions, 2005 – 2050<br />
Fig. K 6: Final energy consumption by private households in the innovation scenario broken down according to energy<br />
sources and uses, in PJ, index of direct CO 2 emissions, 2005 – 2050<br />
Fig. K 7: Final energy consumption by the services sector in the innovation scenario, broken down according to types of use<br />
and energy sources, in PJ, index of direct CO 2 emissions, 2005 – 2050<br />
Fig. K 8: Final energy consumption by the industrial sector in the innovation scenario, broken down according to types of use<br />
and energy sources, in PJ, index of direct CO 2 emissions,2005 – 2050<br />
Fig. K 9: Final energy consumption by passenger and freight transport in the innovation scenario, broken down according<br />
to forms of transport, in PJ, 2005 – 2050<br />
Fig. K 10: Final energy consumption by passenger and freight transport in the innovation scenario, broken down according to<br />
energy sources, in PJ, index of direct CO 2 emissions, 2005 – 2050<br />
Fig. K 11: Total final energy consumption in the innovation scenario, broken down according to energy sources and sectors,<br />
in PJ, index of direct CO 2 emissions, 2005 – 2050<br />
Fig. K 12: Net electricity generation by German power stations in the innovation scenario (variant without CCS), broken down<br />
according to energy sources in TWh, 2005 – 2050<br />
Fig. K 13: Net electricity generation by German power stations in the innovation scenario (variant with CCS), broken down into<br />
energy sources, in PJ, in TWh, 2005 – 2050<br />
Fig. K 14: Primary energy consumption (without non-energetic consumption) in the innovation scenario (variant without CCS),<br />
broken down according to energy sources and sectors, index of energy-related CO 2 emissions, 2005 – 2050<br />
Fig. K 15: Additional cost of the innovation scenario for the national economy vs. saved expenditure for imported fossil fuels,<br />
2010 – 2050, in billion € (real, 2000)<br />
Fig. K 16: Elements of additional costs in the innovation scenario in Mio. € (real, 2000)<br />
Fig. K 17: Energy-related greenhouse gas emissions in the innovation scenario (variant with CCS) in million tonnes of<br />
CO 2 equivalents, 1990 – 2050<br />
Fig. K 18: Energy-related greenhouse gas emissions in the innovation scenario (variant with CCS) in million tonnes of<br />
CO 2 equivalents, 1990 – 2050


