trigonometry

Create successful ePaper yourself
Turn your PDF publications into a flip-book with our unique Google optimized e-Paper software.
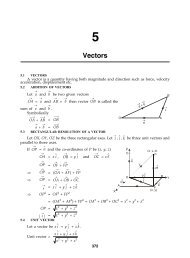
Geometry and <strong>trigonometry</strong><br />
15<br />
Trigonometric waveforms<br />
15.1 Graphs of trigonometric functions<br />
By drawing up tables of values from 0 ◦ to 360 ◦ ,<br />
graphs of y = sin A, y = cos A and y = tan A may be<br />
plotted. Values obtained with a calculator (correct<br />
to 3 decimal places—which is more than sufficient<br />
for plotting graphs), using 30 ◦ intervals, are shown<br />
below, with the respective graphs shown in Fig. 15.1.<br />
(a) y = sin A<br />
A 0 30 ◦ 60 ◦ 90 ◦ 120 ◦ 150 ◦ 180 ◦<br />
sin A 0 0.500 0.866 1.000 0.866 0.500 0<br />
A 210 ◦ 240 ◦ 270 ◦ 300 ◦ 330 ◦ 360 ◦<br />
sin A −0.500 −0.866 −1.000 −0.866 −0.500 0<br />
(b) y = cos A<br />
A 0 30 ◦ 60 ◦ 90 ◦ 120 ◦ 150 ◦ 180 ◦<br />
cos A 1.000 0.866 0.500 0 −0.500 −0.866 −1.000<br />
A 210 ◦ 240 ◦ 270 ◦ 300 ◦ 330 ◦ 360 ◦<br />
cos A −0.866 −0.500 0 0.500 0.866 1.000<br />
(c) y = tan A<br />
A 0 30 ◦ 60 ◦ 90 ◦ 120 ◦ 150 ◦ 180 ◦<br />
tan A 0 0.577 1.732 ∞ −1.732 −0.577 0<br />
A 210 ◦ 240 ◦ 270 ◦ 300 ◦ 330 ◦ 360 ◦<br />
tan A 0.577 1.732 ∞ −1.732 −0.577 0<br />
From Figure 15.1 it is seen that:<br />
(i) Sine and cosine graphs oscillate between peak<br />
values of ±1.<br />
(ii) The cosine curve is the same shape as the sine<br />
curve but displaced by 90 ◦ .<br />
Figure 15.1<br />
(iii) The sine and cosine curves are continuous and<br />
they repeat at intervals of 360 ◦ ; the tangent<br />
curve appears to be discontinuous and repeats<br />
at intervals of 180 ◦ .<br />
15.2 Angles of any magnitude<br />
(i) Figure 15.2 shows rectangular axes XX ′ and YY ′<br />
intersecting at origin 0.As with graphical work,<br />
measurements made to the right and above 0 are<br />
positive while those to the left and downwards<br />
are negative. Let OA be free to rotate about 0.