trigonometry

Create successful ePaper yourself
Turn your PDF publications into a flip-book with our unique Google optimized e-Paper software.
152 GEOMETRY AND TRIGONOMETRY<br />
Figure 15.10<br />
Figure 15.11<br />
graph, then a sine wave is produced as shown in<br />
Fig. 15.10.<br />
If all horizontal components such as OS are projected<br />
on to a graph of y against angle x ◦ , then a<br />
cosine wave is produced. It is easier to visualize<br />
these projections by redrawing the circle with the<br />
radius arm OR initially in a vertical position as shown<br />
in Fig. 15.11.<br />
From Figures 15.10 and 15.11 it is seen that a<br />
cosine curve is of the same form as the sine curve<br />
but is displaced by 90 ◦ (or π/2 radians).<br />
15.4 Sine and cosine curves<br />
Graphs of sine and cosine waveforms<br />
(i) A graph of y = sin A is shown by the broken line<br />
in Fig. 15.12 and is obtained by drawing up a<br />
table of values as in Section 15.1.A similar table<br />
may be produced for y = sin 2A.<br />
A ◦ 2A sin 2A<br />
0 0 0<br />
30 60 0.866<br />
45 90 1.0<br />
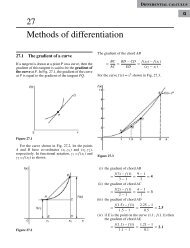
60 120 0.866<br />
90 180 0<br />
120 240 −0.866<br />
135 270 −1.0<br />
150 300 −0.866<br />
180 360 0<br />
210 420 0.866<br />
225 450 1.0<br />
240 480 0.866<br />
270 540 0<br />
300 600 −0.866<br />
315 630 −1.0<br />
330 660 −0.866<br />
360 720 0