Point-and-Figure Charting - Bredbandsbolaget
Point-and-Figure Charting - Bredbandsbolaget
Point-and-Figure Charting - Bredbandsbolaget
Create successful ePaper yourself
Turn your PDF publications into a flip-book with our unique Google optimized e-Paper software.
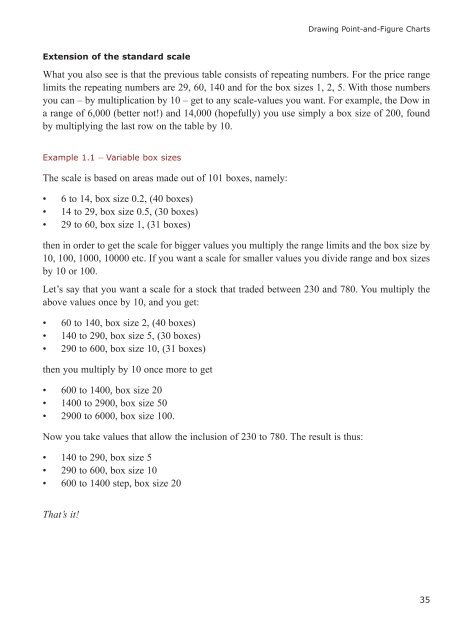
Extension of the st<strong>and</strong>ard scale<br />
What you also see is that the previous table consists of repeating numbers. For the price range<br />
limits the repeating numbers are 29, 60, 140 <strong>and</strong> for the box sizes 1, 2, 5. With those numbers<br />
you can – by multiplication by 10 – get to any scale-values you want. For example, the Dow in<br />
a range of 6,000 (better not!) <strong>and</strong> 14,000 (hopefully) you use simply a box size of 200, found<br />
by multiplying the last row on the table by 10.=====<br />
Example 1.1 – Variable box sizes<br />
The scale is based on areas made out of 101 boxes, namely:<br />
• 6 to 14, box size 0.2, (40 boxes)<br />
• 14 to 29, box size 0.5, (30 boxes)<br />
• 29 to 60, box size 1, (31 boxes)<br />
then in order to get the scale for bigger values you multiply the range limits <strong>and</strong> the box size by<br />
10, 100, 1000, 10000 etc. If you want a scale for smaller values you divide range <strong>and</strong> box sizes<br />
by 10 or 100.<br />
Let’s say that you want a scale for a stock that traded between 230 <strong>and</strong> 780. You multiply the<br />
above values once by 10, <strong>and</strong> you get:<br />
• 60 to 140, box size 2, (40 boxes)<br />
• 140 to 290, box size 5, (30 boxes)<br />
• 290 to 600, box size 10, (31 boxes)<br />
then you multiply by 10 once more to get<br />
• 600 to 1400, box size 20<br />
• 1400 to 2900, box size 50<br />
• 2900 to 6000, box size 100.<br />
Now you take values that allow the inclusion of 230 to 780. The result is thus:<br />
• 140 to 290, box size 5<br />
• 290 to 600, box size 10<br />
• 600 to 1400 step, box size 20<br />
That’s it!<br />
=====<br />
Drawing <strong>Point</strong>-<strong>and</strong>-<strong>Figure</strong> Charts<br />
35


