108139-1 Study Title Data Requirements Author Study ... - IR-4 Project
108139-1 Study Title Data Requirements Author Study ... - IR-4 Project
108139-1 Study Title Data Requirements Author Study ... - IR-4 Project

Create successful ePaper yourself
Turn your PDF publications into a flip-book with our unique Google optimized e-Paper software.
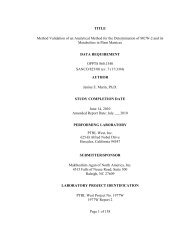
Bayer Corporation <strong>108139</strong>-1<br />
Agriculture Division<br />
4.2 Addition of Internal Standard Solution<br />
A standard containing the deuterated standard was added immediately after the extraction to<br />
account for any loss during sample clean-up. The addition was made using the same accurate<br />
pipette for each addition. The accuracy of the pipette was important since the response factors<br />
calculated in the sample extracts were compared to the response factor of the quantification<br />
standard, which was made using an accurate pipette.<br />
4.3 GC/MS of Cyfluthrin<br />
In the current method, the gas chromatography procedure in combination with the mass<br />
spectrometer using negative chemical ionization was selected to replace the gas<br />
chromatographic/mass spectrometry procedure using positive electron impact ionization. This<br />
modification was performed to increase sensitivity and selectivity thus reducing the amount of<br />
clean-up. In addition, the use of an internal standard compensated for loss during sample<br />
clean-up. Due to the increase in sensitivity, less sample was required to maintain an LOQ of<br />
0.01 ppm.<br />
Figures 5 through 144 show typical negative chemical ionization selected ion monitoring (SIM)<br />
ion-chromatograms of cyfluthrin, and [ 2 H6]cyfluthrin standard solutions and matrix extract<br />
solutions. Cyfluthrin is represented by ion m/z 207. [ 2 H6]Cyfluthrin is represented by ion<br />
m/z 213. Proposed fragmentation of Cyfluthrin is shown in Appendix 4.<br />
The presence of eight diastereomers (four pairs) in cyfluthrin creates three peaks that are not<br />
base line resolved. All three peaks are integrated as one peak area and used to quantitate<br />
cyfluthrin.<br />
4.4 Recovery of Cyfluthrin<br />
Tables 1 through 28 list data for recoveries, control values, standard deviations, and average<br />
recoveries for cyfluthrin from various plant matrices. Figures 5 through 144 show typical<br />
chromatograms of standards and control samples, and recovery samples for various plant<br />
matrices. All recoveries cyfluthrin at all fortification levels fell within the 70% to 120% range<br />
except for the 6.5 ppm fortifications in peanut hay which were just below 70%.<br />
4.5 Limits of Quantitation and Detection (Except Apple and Pears)<br />
The limits of quantitation (LOQ) based on the lowest ppm levels fortified of were 0.01 ppm for all<br />
the plant matrices analyzed.<br />
The limit of detection (LOD) is defined as the lowest concentration that can be determined to be<br />
statistically different from a blank or negative control. The LOD was calculated by taking the<br />
standard deviation of the residue values from the analysis of the recovery samples at the LOQ<br />
and using the equation shown below:<br />
42