

The production capacity of intercropped model of maize (Zea mays) with black locust (Robinia pseudoacacia)
A study was conducted to investigate the intercropping of legumes with cereals in different space as an approach to improve the soil nutrient content, the forage quality and the yield of cereals. Black locust was cultivated alone and intercropped with maize as follows: 2 rows maize to 2 rows Black locust (2M2R), 2 rows maize to 4 rows Black locust (2M4R), 2 rows maize to 6 rows Black locust (2M6R); 4 rows maize to 2 rows Black locust (4M2R), 4 rows maize to 4 rows Black locust (4M4R), 4 rows maize to 6 rows Black locust (4M6R) and 6 rows maize to 2 rows Black locust (6M2R), 6 rows maize to 4 rows Black locust (6M4R), 6 rows maize to 6 rows Black locust (6M6R).The experiment was laid out in randomized complete block design with three treatments and three replications. The results indicated significant increase of soil available phosphorus and soil organic matter in 2017 at harvest, while soil total nitrogen and soil available potassium decreased. However, total nitrogen and organic matter were higher in black locust leaves, black locust stems and maize stem. Low maize yield were founded in the major part of treatments while the highest biomass was founded in plants stem diameter. An increase is observed in maize and black locust height. Significant differences were founded in the character of black locust stem basal diameter. Also, significant differences in Chlorophyll concentration and WUE were observed.
A study was conducted to investigate the intercropping of legumes with cereals in different space as an approach to improve the soil nutrient content, the forage quality and the yield of cereals. Black locust was cultivated alone and intercropped with maize as follows: 2 rows maize to 2 rows Black locust (2M2R), 2 rows maize to 4 rows Black locust (2M4R), 2 rows maize to 6 rows Black locust (2M6R); 4 rows maize to 2 rows Black locust (4M2R), 4 rows maize to 4 rows Black locust (4M4R), 4 rows maize to 6 rows Black locust (4M6R) and 6 rows maize to 2 rows Black locust (6M2R), 6 rows maize to 4 rows Black locust (6M4R), 6 rows maize to 6 rows Black locust (6M6R).The experiment was laid out in randomized complete block design with three treatments and three replications. The results indicated significant increase of soil available phosphorus and soil organic matter in 2017 at harvest, while soil total nitrogen and soil available potassium decreased. However, total nitrogen and organic matter were higher in black locust leaves, black locust stems and maize stem. Low maize yield were founded in the major part of treatments while the highest biomass was founded in plants stem diameter. An increase is observed in maize and black locust height. Significant differences were founded in the character of black locust stem basal diameter. Also, significant differences in Chlorophyll concentration and WUE were observed.

You also want an ePaper? Increase the reach of your titles
YUMPU automatically turns print PDFs into web optimized ePapers that Google loves.
Int. J. Agron. Agri. R.<br />
<strong>The</strong> t-test was used to test the differences in soil<br />
properties between treatments. Correlation analysis<br />
was performed to show the relationships among<br />
different properties.<br />
Results<br />
Soil chemical properties<br />
Analysis <strong>of</strong> variance revealed significant differences<br />
among all the treatments and depths for total<br />
nitrogen (TN), available phosphorus (AP), available<br />
potassium (AK) and organic matter (OM) at both<br />
sowing and harvest in 2016 and 2017 (Table 2). In<br />
2016, Compared to OM content, TN, AP and AK<br />
displayed a decreasing trend from the upper soil layer<br />
to the lower soil layer at sowing, while exhibiting an<br />
increasing trend at harvest. In 2017, AP content<br />
displayed a decreasing trend from the upper soil layer<br />
to the lower soil layer, compared to TN, AK and OM<br />
at sowing, while showing an increasing trend at<br />
harvest. In 2016, <strong>intercropped</strong> <strong>maize</strong> x <strong>black</strong> <strong>locust</strong><br />
treatments showed higher TN, AP, AK and OM than<br />
sole <strong>black</strong> <strong>locust</strong> treatment, indicating a positive<br />
effect <strong>of</strong> the intercropping. Meanwhile, in 2017, sole<br />
<strong>black</strong> <strong>locust</strong> treatment <strong>intercropped</strong> showed higher<br />
AP, AK and OM than <strong>maize</strong> x <strong>black</strong> <strong>locust</strong> treatments,<br />
but lower TN, indicating a negative effect <strong>of</strong> the longterm<br />
intercropping.<br />
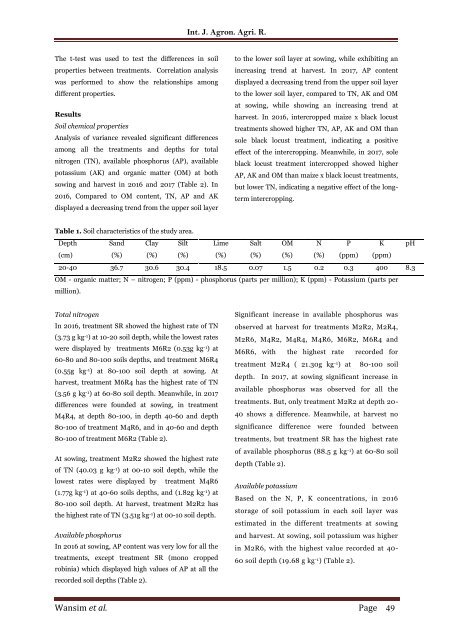
Table 1. Soil characteristics <strong>of</strong> the study area.<br />
Depth Sand Clay Silt Lime Salt OM N P K pH<br />
(cm) (%) (%) (%) (%) (%) (%) (%) (ppm) (ppm)<br />
20-40 36.7 30.6 30.4 18.5 0.07 1.5 0.2 0.3 400 8.3<br />
OM - organic matter; N – nitrogen; P (ppm) - phosphorus (parts per million); K (ppm) - Potassium (parts per<br />
million).<br />
Total nitrogen<br />
In 2016, treatment SR showed the highest rate <strong>of</strong> TN<br />
(3.73 g kg -1 ) at 10-20 soil depth, while the lowest rates<br />
were displayed by treatments M6R2 (0.53g kg -1 ) at<br />
60-80 and 80-100 soils depths, and treatment M6R4<br />
(0.55g kg -1 ) at 80-100 soil depth at sowing. At<br />
harvest, treatment M6R4 has the highest rate <strong>of</strong> TN<br />
(3.56 g kg -1 ) at 60-80 soil depth. Meanwhile, in 2017<br />
differences were founded at sowing, in treatment<br />
M4R4, at depth 80-100, in depth 40-60 and depth<br />
80-100 <strong>of</strong> treatment M4R6, and in 40-60 and depth<br />
80-100 <strong>of</strong> treatment M6R2 (Table 2).<br />
At sowing, treatment M2R2 showed the highest rate<br />
<strong>of</strong> TN (40.03 g kg -1 ) at 00-10 soil depth, while the<br />
lowest rates were displayed by treatment M4R6<br />
(1.77g kg -1 ) at 40-60 soils depths, and (1.82g kg -1 ) at<br />
80-100 soil depth. At harvest, treatment M2R2 has<br />
the highest rate <strong>of</strong> TN (3.51g kg -1 ) at 00-10 soil depth.<br />
Available phosphorus<br />
In 2016 at sowing, AP content was very low for all the<br />
treatments, except treatment SR (mono cropped<br />
robinia) which displayed high values <strong>of</strong> AP at all the<br />
recorded soil depths (Table 2).<br />
Significant increase in available phosphorus was<br />
observed at harvest for treatments M2R2, M2R4,<br />
M2R6, M4R2, M4R4, M4R6, M6R2, M6R4 and<br />
M6R6, <strong>with</strong> the highest rate recorded for<br />
treatment M2R4 ( 21.30g kg -1 ) at 80-100 soil<br />
depth. In 2017, at sowing significant increase in<br />
available phosphorus was observed for all the<br />
treatments. But, only treatment M2R2 at depth 20-<br />
40 shows a difference. Meanwhile, at harvest no<br />
significance difference were founded between<br />
treatments, but treatment SR has the highest rate<br />
<strong>of</strong> available phosphorus (88.5 g kg -1 ) at 60-80 soil<br />
depth (Table 2).<br />
Available potassium<br />
Based on the N, P, K concentrations, in 2016<br />
storage <strong>of</strong> soil potassium in each soil layer was<br />
estimated in the different treatments at sowing<br />
and harvest. At sowing, soil potassium was higher<br />
in M2R6, <strong>with</strong> the highest value recorded at 40-<br />
60 soil depth (19.68 g kg -1 ) (Table 2).<br />
Wansim et al. Page 49


