

The production capacity of intercropped model of maize (Zea mays) with black locust (Robinia pseudoacacia)
A study was conducted to investigate the intercropping of legumes with cereals in different space as an approach to improve the soil nutrient content, the forage quality and the yield of cereals. Black locust was cultivated alone and intercropped with maize as follows: 2 rows maize to 2 rows Black locust (2M2R), 2 rows maize to 4 rows Black locust (2M4R), 2 rows maize to 6 rows Black locust (2M6R); 4 rows maize to 2 rows Black locust (4M2R), 4 rows maize to 4 rows Black locust (4M4R), 4 rows maize to 6 rows Black locust (4M6R) and 6 rows maize to 2 rows Black locust (6M2R), 6 rows maize to 4 rows Black locust (6M4R), 6 rows maize to 6 rows Black locust (6M6R).The experiment was laid out in randomized complete block design with three treatments and three replications. The results indicated significant increase of soil available phosphorus and soil organic matter in 2017 at harvest, while soil total nitrogen and soil available potassium decreased. However, total nitrogen and organic matter were higher in black locust leaves, black locust stems and maize stem. Low maize yield were founded in the major part of treatments while the highest biomass was founded in plants stem diameter. An increase is observed in maize and black locust height. Significant differences were founded in the character of black locust stem basal diameter. Also, significant differences in Chlorophyll concentration and WUE were observed.
A study was conducted to investigate the intercropping of legumes with cereals in different space as an approach to improve the soil nutrient content, the forage quality and the yield of cereals. Black locust was cultivated alone and intercropped with maize as follows: 2 rows maize to 2 rows Black locust (2M2R), 2 rows maize to 4 rows Black locust (2M4R), 2 rows maize to 6 rows Black locust (2M6R); 4 rows maize to 2 rows Black locust (4M2R), 4 rows maize to 4 rows Black locust (4M4R), 4 rows maize to 6 rows Black locust (4M6R) and 6 rows maize to 2 rows Black locust (6M2R), 6 rows maize to 4 rows Black locust (6M4R), 6 rows maize to 6 rows Black locust (6M6R).The experiment was laid out in randomized complete block design with three treatments and three replications. The results indicated significant increase of soil available phosphorus and soil organic matter in 2017 at harvest, while soil total nitrogen and soil available potassium decreased. However, total nitrogen and organic matter were higher in black locust leaves, black locust stems and maize stem. Low maize yield were founded in the major part of treatments while the highest biomass was founded in plants stem diameter. An increase is observed in maize and black locust height. Significant differences were founded in the character of black locust stem basal diameter. Also, significant differences in Chlorophyll concentration and WUE were observed.

You also want an ePaper? Increase the reach of your titles
YUMPU automatically turns print PDFs into web optimized ePapers that Google loves.
Int. J. Agron. Agri. R.<br />
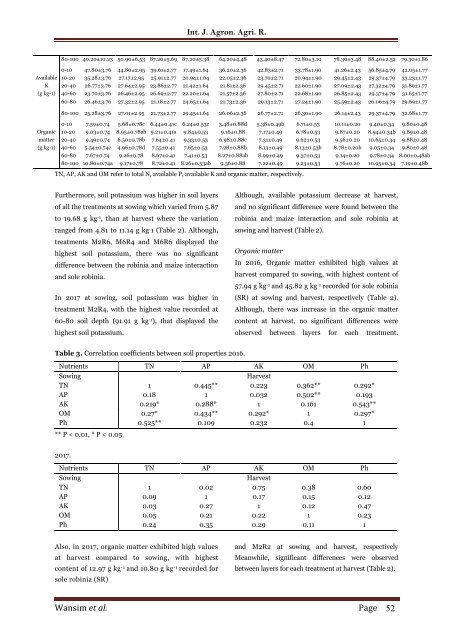
80-100 40.20±10.23 50.90±6.53 87.20±5.69 87.20±5.38 64.20±4.48 43.40±8.47 72.80±3.10 78.30±3.48 88.40±2.52 79.30±1.86<br />
0-10 47.80±3.76 44.80±2.95 39.61±2.77 17.49±1.64 36.20±2.36 42.83±2.71 33.78±1.90 41.26±2.43 56.85±4.79 42.05±1.77<br />
Available 10-20 35.28±3.76 27.17±2.95 25.91±2.77 20.94±1.64 22.05±2.36 23.70±2.71 20.94±1.90 29.45±2.43 29.37±4.79 33.23±1.77<br />
K 20-40 26.77±3.76 27.64±2.95 23.86±2.77 21.42±1.64 21.81±2.36 29.45±2.71 22.60±1.90 27.09±2.43 27.32±4.79 31.89±1.77<br />
(g kg-1) 40-60 23.70±3.76 26.46±2.95 26.69±2.77 22.20±1.64 21.57±2.36 27.80±2.71 22.68±1.90 26.85±2.43 29.37±4.79 31.65±1.77<br />
60-80 26.46±3.76 27.32±2.95 21.18±2.77 24.65±1.64 21.73±2.36 29.13±2.71 27.24±1.90 25.59±2.43 26.06±4.79 29.69±1.77<br />
80-100 25.28±3.76 27.01±2.95 21.73±2.77 29.45±1.64 26.06±2.36 26.77±2.71 26.30±1.90 26.14±2.43 29.37±4.79 32.68±1.77<br />
0-10 7.59±0.74 5.68±0.78c 6.44±0.41c 6.24±0.53c 3.48±0.88d 5.38±0.49b 6.71±0.53 10.11±0.20 9.40±0.34 9.80±0.48<br />
Organic 10-20 9.03±0.74 8.95±0.78ab 9.21±0.41a 9.84±0.53 9.16±0.88 7.17±0.49 6.78±0.53 9.87±0.20 8.94±0.34b 9.89±0.48<br />
matter 20-40 9.49±0.74 6.50±0.78b 7.64±0.41 9.33±0.53 6.98±0.88c 7.31±0.49 9.62±0.53 9.56±0.20 10.65±0.34 9.88±0.48<br />
(g kg-1) 40-60 5.54±0.74c 4.96±0.78d 7.55±0.41 7.65±0.53 7.28±0.88b 8.13±0.49 8.13±0.53b 8.78±0.20b 9.05±0.34 9.80±0.48<br />
60-80 7.67±0.74 9.26±0.78 8.67±0.41 7.41±0.53 8.27±0.88ab 8.99±0.49 9.37±0.53 9.14±0.20 9.78±0.34 8.00±0.48ab<br />
80-100 10.80±0.74a 9.17±0.78 8.72±0.41 8.26±0.53ab 9.36±0.88 7.22±0.49 9.23±0.53 9.76±0.20 10.95±0.34 7.19±0.48b<br />
TN, AP, AK and OM refer to total N, available P, available K and organic matter, respectively.<br />
Furthermore, soil potassium was higher in soil layers<br />
<strong>of</strong> all the treatments at sowing which varied from 5.87<br />
to 19.68 g kg -1 , than at harvest where the variation<br />
ranged from 4.81 to 11.14 g kg - 1 (Table 2). Although,<br />
treatments M2R6, M6R4 and M6R6 displayed the<br />
highest soil potassium, there was no significant<br />
difference between the robinia and <strong>maize</strong> interaction<br />
and sole robinia.<br />
In 2017 at sowing, soil potassium was higher in<br />
treatment M2R4, <strong>with</strong> the highest value recorded at<br />
60-80 soil depth (91.91 g kg -1 ), that displayed the<br />
highest soil potassium.<br />
Although, available potassium decrease at harvest,<br />
and no significant difference were found between the<br />
robinia and <strong>maize</strong> interaction and sole robinia at<br />
sowing and harvest (Table 2).<br />
Organic matter<br />
In 2016, Organic matter exhibited high values at<br />
harvest compared to sowing, <strong>with</strong> highest content <strong>of</strong><br />
57.94 g kg -1 and 45.82 g kg -1 recorded for sole robinia<br />
(SR) at sowing and harvest, respectively (Table 2).<br />
Although, there was increase in the organic matter<br />
content at harvest, no significant differences were<br />
observed between layers for each treatment.<br />
Table 3. Correlation coefficients between soil properties 2016.<br />
Nutrients TN AP AK OM Ph<br />
Sowing<br />
Harvest<br />
TN 1 0.445** 0.223 0.362** 0.292*<br />
AP 0.18 1 0.032 0.502** 0.193<br />
AK 0.219* 0.288* 1 0.161 0.543**<br />
OM 0.27* 0.434** 0.292* 1 0.297*<br />
Ph 0.525** 0.109 0.232 0.4 1<br />
** P < 0.01, * P < 0.05.<br />
2017.<br />
Nutrients TN AP AK OM Ph<br />
Sowing<br />
Harvest<br />
TN 1 0.02 0.75 0.38 0.60<br />
AP 0.09 1 0.17 0.15 0.12<br />
AK 0.03 0.27 1 0.12 0.47<br />
OM 0.05 0.21 0.22 1 0.23<br />
Ph 0.24 0.35 0.29 0.11 1<br />
Also, in 2017, organic matter exhibited high values<br />
at harvest compared to sowing, <strong>with</strong> highest<br />
content <strong>of</strong> 12.97 g kg -1 and 10.80 g kg -1 recorded for<br />
sole robinia (SR)<br />
and M2R2 at sowing and harvest, respectively<br />
Meanwhile, significant differences were observed<br />
between layers for each treatment at harvest (Table 2).<br />
Wansim et al. Page 52


