
You also want an ePaper? Increase the reach of your titles
YUMPU automatically turns print PDFs into web optimized ePapers that Google loves.
MELTING SHOP<br />
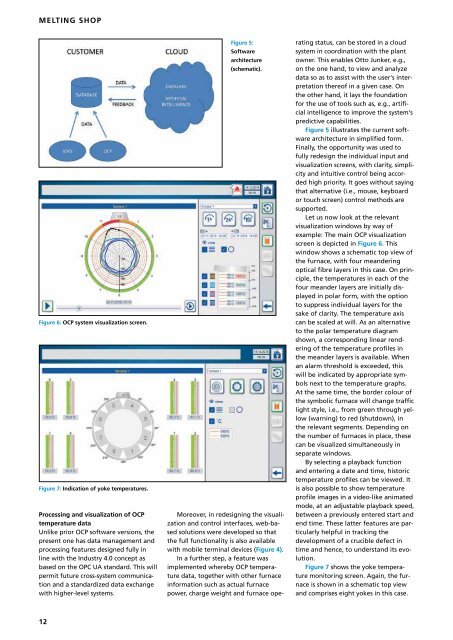
Figure 6: OCP system visualization screen.<br />
Figure 7: Indication of yoke temperatures.<br />
Processing and visualization of OCP<br />
temperature data<br />
Unlike prior OCP software versions, the<br />
present one has data management and<br />
processing features designed fully in<br />
line with the Industry 4.0 concept as<br />
based on the OPC UA standard. This will<br />
permit future cross-system communication<br />
and a standardized data exchange<br />
with higher-level systems.<br />
Figure 5:<br />
Software<br />
architecture<br />
(schematic).<br />
Moreover, in redesigning the visualization<br />
and control interfaces, web-based<br />
solutions were developed so that<br />
the full functionality is also available<br />
with mobile terminal devices (Figure 4).<br />
In a further step, a feature was<br />
implemented whereby OCP temperature<br />
data, together with other furnace<br />
information such as actual furnace<br />
power, charge weight and furnace operating<br />
status, can be stored in a cloud<br />
system in coordination with the plant<br />
owner. This enables Otto Junker, e.g.,<br />
on the one hand, to view and analyze<br />
data so as to assist with the user‘s interpretation<br />
thereof in a given case. On<br />
the other hand, it lays the foundation<br />
for the use of tools such as, e.g., artificial<br />
intelligence to improve the system‘s<br />
predictive capabilities.<br />
Figure 5 illustrates the current software<br />
architecture in simplified form.<br />
Finally, the opportunity was used to<br />
fully redesign the individual input and<br />
visualization screens, with clarity, simplicity<br />
and intuitive control being accorded<br />
high priority. It goes without saying<br />
that alternative (i.e., mouse, keyboard<br />
or touch screen) control methods are<br />
supported.<br />
Let us now look at the relevant<br />
visualization windows by way of<br />
example: The main OCP visualization<br />
screen is depicted in Figure 6. This<br />
window shows a schematic top view of<br />
the furnace, with four meandering<br />
optical fibre layers in this case. On principle,<br />
the temperatures in each of the<br />
four meander layers are initially displayed<br />
in polar form, with the option<br />
to suppress individual layers for the<br />
sake of clarity. The temperature axis<br />
can be scaled at will. As an alternative<br />
to the polar temperature diagram<br />
shown, a corresponding linear rendering<br />
of the temperature profiles in<br />
the meander layers is available. When<br />
an alarm threshold is exceeded, this<br />
will be indicated by appropriate symbols<br />
next to the temperature graphs.<br />
At the same time, the border colour of<br />
the symbolic furnace will change traffic<br />
light style, i.e., from green through yellow<br />
(warning) to red (shutdown), in<br />
the relevant segments. Depending on<br />
the number of furnaces in place, these<br />
can be visualized simultaneously in<br />
separate windows.<br />
By selecting a playback function<br />
and entering a date and time, historic<br />
temperature profiles can be viewed. It<br />
is also possible to show temperature<br />
profile images in a video-like animated<br />
mode, at an adjustable playback speed,<br />
between a previously entered start and<br />
end time. These latter features are particularly<br />
helpful in tracking the<br />
development of a crucible defect in<br />
time and hence, to understand its evolution.<br />
Figure 7 shows the yoke temperature<br />
monitoring screen. Again, the furnace<br />
is shown in a schematic top view<br />
and comprises eight yokes in this case.<br />
12