DCN October Edition 2019

You also want an ePaper? Increase the reach of your titles
YUMPU automatically turns print PDFs into web optimized ePapers that Google loves.
WINTER CROP PRODUCTION AND AREA,<br />
AUSTRALIA, 2017–18 TO <strong>2019</strong>–20<br />
CROP AREA PRODUCTION<br />
2017-18<br />
‘000 ha<br />
2018-19 s<br />
‘000 ha<br />
<strong>2019</strong>-20 f<br />
‘000 h<br />
2017-18<br />
kt<br />
2018-19<br />
s - kt<br />
<strong>2019</strong>-20<br />
f - kt<br />
Wheat 10919 10919 10770 20941 17298 19102<br />
Barley 4124 3719 4125 9254 8310 9479<br />
Canola 3171 1893 1983 3893 2180 2304<br />
Chickpeas 1075 303 276 998 282 284<br />
Faba beans 313 178 194 416 217 301<br />
Field peas 291 179 220 317 152 255<br />
Lentils 418 303 269 543 323 343<br />
Lupins 612 500 499 714 693 558<br />
Oats 874 680 728 1227 888 1132<br />
Triticale 55 66 72 87 89 105<br />
f ABARES forecast. s ABARES estimate. Sources: ABARES; Australian Bureau of Statistics;<br />
Pulse Australia<br />
SUMMER CROP PRODUCTION AND AREA,<br />
AUSTRALIA, 2017–18 TO <strong>2019</strong>–20<br />
CROP AREA PRODUCTION<br />
2017-18<br />
‘000 ha<br />
2018-19 s<br />
‘000 ha<br />
<strong>2019</strong>-20 f<br />
‘000 ha<br />
2017-18<br />
kt<br />
2018-19 s<br />
kt<br />
<strong>2019</strong>-20 f<br />
kt<br />
Grain sorghum 462 496 391 1255 1278 992<br />
Cottonseed a 526 343 145 1497 686 416<br />
Cotton lint a 526 343 145 1058 485 294<br />
Rice 61 5 5 635 61 59<br />
Corn (maize) 53 55 61 387 392 430<br />
Soybeans 32 26 25 51 42 41<br />
Sunflower 14 19 19 26 23 24<br />
a Cotton area is estimated harvested area. f ABARES forecast. s ABARES estimate.<br />
Sources: ABARES; Australian Bureau of Statistics; Cotton Australia.<br />
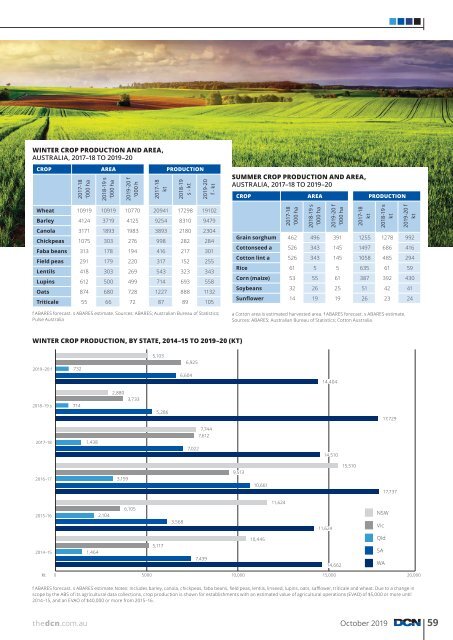
WINTER CROP PRODUCTION, BY STATE, 2014–15 TO <strong>2019</strong>–20 (KT)<br />
5,103<br />
6,925<br />
<strong>2019</strong>–20 f<br />
732<br />
6,604<br />
14,404<br />
2,880<br />
3,733<br />
2018–19 s<br />
714<br />
5,286<br />
17,729<br />
7,744<br />
7,612<br />
2017–18<br />
1,438<br />
7,022<br />
14,510<br />
15,510<br />
9,513<br />
2016–17<br />
3,159<br />
10,661<br />
17,737<br />
11,624<br />
2015–16<br />
2,104<br />
6,105<br />
NSW<br />
3,568<br />
11,624<br />
Vic<br />
10,445<br />
Qld<br />
2014–15<br />
1,464<br />
5,117<br />
SA<br />
7,439<br />
14,662<br />
WA<br />
Kt<br />
0 5000 10,000 15,000 20,000<br />
f ABARES forecast. s ABARES estimate. Notes: Includes barley, canola, chickpeas, faba beans, field peas, lentils, linseed, lupins, oats, safflower, triticale and wheat. Due to a change in<br />
scope by the ABS of its agricultural data collections, crop production is shown for establishments with an estimated value of agricultural operations (EVAO) of $5,000 or more until<br />
2014–15, and an EVAO of $40,000 or more from 2015–16.<br />
thedcn.com.au <strong>October</strong> <strong>2019</strong> 59