Report - Risk Management in Brazilian Agriculture

You also want an ePaper? Increase the reach of your titles
YUMPU automatically turns print PDFs into web optimized ePapers that Google loves.
2006 2018<br />
2. Brazil’s Primary <strong>Risk</strong> <strong>Management</strong> Instruments and Policies<br />
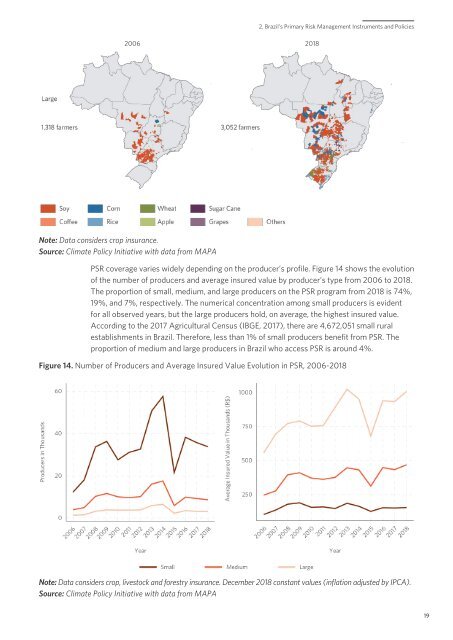
Note: Data considers crop <strong>in</strong>surance.<br />
Source: Climate Policy Initiative with data from MAPA<br />
PSR coverage varies widely depend<strong>in</strong>g on the producer’s profile. Figure 14 shows the evolution<br />
of the number of producers and average <strong>in</strong>sured value by producer’s type from 2006 to 2018.<br />
The proportion of small, medium, and large producers on the PSR program from 2018 is 74%,<br />
19%, and 7%, respectively. The numerical concentration among small producers is evident<br />
for all observed years, but the large producers hold, on average, the highest <strong>in</strong>sured value.<br />
Accord<strong>in</strong>g to the 2017 Agricultural Census (IBGE, 2017), there are 4,672,051 small rural<br />
establishments <strong>in</strong> Brazil. Therefore, less than 1% of small producers benefit from PSR. The<br />
proportion of medium and large producers <strong>in</strong> Brazil who access PSR is around 4%.<br />
Figure 14. Number of Producers and Average Insured Value Evolution <strong>in</strong> PSR, 2006-2018<br />
Note: Data considers crop, livestock and forestry <strong>in</strong>surance. December 2018 constant values (<strong>in</strong>flation adjusted by IPCA).<br />
Source: Climate Policy Initiative with data from MAPA<br />
19