Report - Risk Management in Brazilian Agriculture

Create successful ePaper yourself
Turn your PDF publications into a flip-book with our unique Google optimized e-Paper software.
2. Brazil’s Primary <strong>Risk</strong> <strong>Management</strong> Instruments and Policies<br />
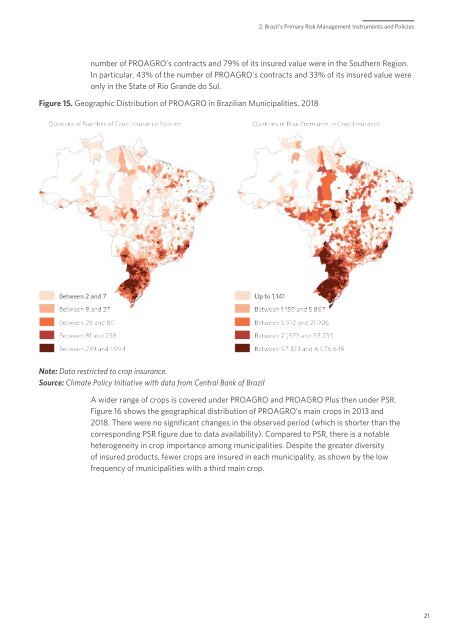
number of PROAGRO’s contracts and 79% of its <strong>in</strong>sured value were <strong>in</strong> the Southern Region.<br />
In particular, 43% of the number of PROAGRO’s contracts and 33% of its <strong>in</strong>sured value were<br />
only <strong>in</strong> the State of Rio Grande do Sul.<br />
Figure 15. Geographic Distribution of PROAGRO <strong>in</strong> <strong>Brazilian</strong> Municipalities, 2018<br />
Note: Data restricted to crop <strong>in</strong>surance.<br />
Source: Climate Policy Initiative with data from Central Bank of Brazil<br />
A wider range of crops is covered under PROAGRO and PROAGRO Plus then under PSR.<br />
Figure 16 shows the geographical distribution of PROAGRO’s ma<strong>in</strong> crops <strong>in</strong> 2013 and<br />
2018. There were no significant changes <strong>in</strong> the observed period (which is shorter than the<br />
correspond<strong>in</strong>g PSR figure due to data availability). Compared to PSR, there is a notable<br />
heterogeneity <strong>in</strong> crop importance among municipalities. Despite the greater diversity<br />
of <strong>in</strong>sured products, fewer crops are <strong>in</strong>sured <strong>in</strong> each municipality, as shown by the low<br />
frequency of municipalities with a third ma<strong>in</strong> crop.<br />
21