X-Ray Photoelectron Spectroscopy (XPS/ESCA) - Philips Research
X-Ray Photoelectron Spectroscopy (XPS/ESCA) - Philips Research
X-Ray Photoelectron Spectroscopy (XPS/ESCA) - Philips Research

Create successful ePaper yourself
Turn your PDF publications into a flip-book with our unique Google optimized e-Paper software.
CPS<br />
x 104<br />
6<br />
5<br />
4<br />
3<br />
2<br />
1<br />
0<br />
700<br />
Au 4p1<br />
Au 4p3<br />
O 1s<br />
600<br />
Basic principle<br />
Bombarding a sample in vacuum with X-rays<br />
gives rise to the emission of electrons. If<br />
monochromatic X-rays are used with a<br />
photon energy hν, the kinetic energy of the<br />
emitted electrons Ke is given by:<br />
K<br />
e<br />
= hν<br />
− Be<br />
− φ<br />
where Be is the binding energy of the<br />
atomic orbital from which the electron<br />
originates and φ is the work function. The<br />
work function is the minimum amount<br />
of energy an individual electron needs to<br />
escape from the surface.<br />
Each element produces a unique set<br />
of electrons with specific energies. By<br />
measuring the number of these electrons<br />
as a function of kinetic (or binding) energy,<br />
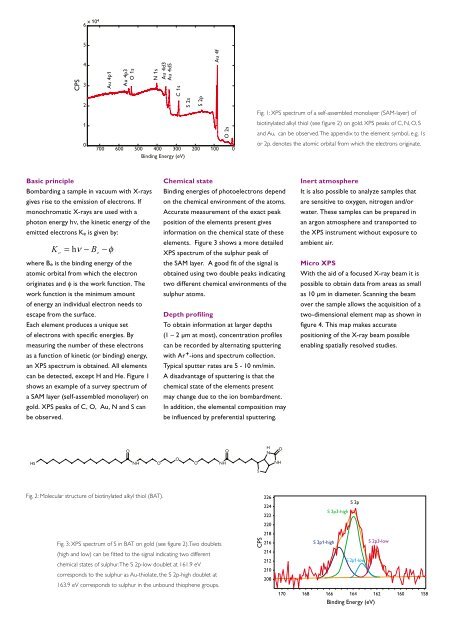
an <strong>XPS</strong> spectrum is obtained. All elements<br />
can be detected, except H and He. Figure 1<br />
shows an example of a survey spectrum of<br />
a SAM layer (self-assembled monolayer) on<br />
gold. <strong>XPS</strong> peaks of C, O, Au, N and S can<br />
be observed.<br />
N 1s<br />
Au 4d3<br />
Au 4d5<br />
C 1s<br />
500 400 300<br />
Binding Energy (eV)<br />
HS NH O<br />
Fig. 2: Molecular structure of biotinylated alkyl thiol (BAT).<br />
O<br />
S 2s<br />
S 2p<br />
200<br />
Au 4f<br />
100<br />
O 2s<br />
Chemical state<br />
Binding energies of photoelectrons depend<br />
on the chemical environment of the atoms.<br />
Accurate measurement of the exact peak<br />
position of the elements present gives<br />
information on the chemical state of these<br />
elements. Figure 3 shows a more detailed<br />
<strong>XPS</strong> spectrum of the sulphur peak of<br />
the SAM layer. A good fit of the signal is<br />
obtained using two double peaks indicating<br />
two different chemical environments of the<br />
sulphur atoms.<br />
Depth profiling<br />
To obtain information at larger depths<br />
(1 – 2 µm at most), concentration profiles<br />
can be recorded by alternating sputtering<br />
with Ar+-ions and spectrum collection.<br />
Typical sputter rates are 5 - 10 nm/min.<br />
A disadvantage of sputtering is that the<br />
chemical state of the elements present<br />
may change due to the ion bombardment.<br />
In addition, the elemental composition may<br />
be influenced by preferential sputtering.<br />
O<br />
O NH<br />
Fig. 3: <strong>XPS</strong> spectrum of S in BAT on gold (see figure 2). Two doublets<br />
(high and low) can be fitted to the signal indicating two different<br />
chemical states of sulphur. The S 2p-low doublet at 161.9 eV<br />
corresponds to the sulphur as Au-thiolate, the S 2p-high doublet at<br />
163.9 eV corresponds to sulphur in the unbound thiophene groups.<br />
O<br />
0<br />
Fig. 1: <strong>XPS</strong> spectrum of a self-assembled monolayer (SAM-layer) of<br />
biotinylated alkyl thiol (see figure 2) on gold. <strong>XPS</strong> peaks of C, N, O, S<br />
and Au, can be observed. The appendix to the element symbol, e.g. 1s<br />
or 2p. denotes the atomic orbital from which the electrons originate.<br />
S<br />
CPS<br />
H<br />
N<br />
226<br />
224<br />
222<br />
220<br />
218<br />
216<br />
214<br />
212<br />
210<br />
208<br />
O<br />
NH<br />
Inert atmosphere<br />
It is also possible to analyze samples that<br />
are sensitive to oxygen, nitrogen and/or<br />
water. These samples can be prepared in<br />
an argon atmosphere and transported to<br />
the <strong>XPS</strong> instrument without exposure to<br />
ambient air.<br />
Micro <strong>XPS</strong><br />
With the aid of a focused X-ray beam it is<br />
possible to obtain data from areas as small<br />
as 10 µm in diameter. Scanning the beam<br />
over the sample allows the acquisition of a<br />
two-dimensional element map as shown in<br />
figure 4. This map makes accurate<br />
positioning of the X-ray beam possible<br />
enabling spatially resolved studies.<br />
S 2p1-high<br />
S 2p3-high<br />
S 2p<br />
S 2p1-low<br />
S 2p3-low<br />
170 168 166 164 162 160 158<br />
Binding Energy (eV)