X-Ray Photoelectron Spectroscopy (XPS/ESCA) - Philips Research
X-Ray Photoelectron Spectroscopy (XPS/ESCA) - Philips Research
X-Ray Photoelectron Spectroscopy (XPS/ESCA) - Philips Research

Create successful ePaper yourself
Turn your PDF publications into a flip-book with our unique Google optimized e-Paper software.
Quantitative analyses<br />
The number of detected electrons is a<br />
measure for the elemental concentration.<br />
In order to obtain quantitative results, peak<br />
areas are divided by standard sensitivity<br />
factors and normalized to 100% to obtain<br />
atomic concentrations. In this way, for<br />
bulk materials the surface composition can<br />
be determined with a 20% inaccuracy in<br />
concentration. However, most materials<br />
do not have a homogeneous chemical<br />
composition in the upper few nanometers,<br />
but rather a composition that varies as<br />
a function of depth. In the case of a real<br />
multi-layer system the signal of an element<br />
in a lower layer will be attenuated more<br />
strongly than the signal from an element<br />
in the top layer. To obtain quantitative<br />
information for non-homogeneous samples,<br />
either angle-resolved measurements or<br />
model calculations can be performed.<br />
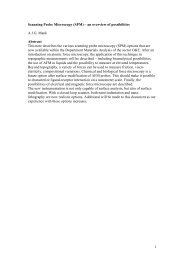
Fig. 5: Schematic of a self-assembled alkane-thiol layer on gold. SAM<br />
layers play an important role in the development of biosensors. The<br />
strong chemical interaction between the thiol (SH) and the gold<br />
surface plus the chain-to-chain interaction of the molecules (e.g. van<br />
der Waals forces) forces the molecules to align parallel to each other<br />
on the gold surface.<br />
S<br />
Au<br />
R<br />
S<br />
R<br />
S<br />
R<br />
S<br />
R<br />
S<br />
Au Au Au Au<br />
Gold Substrate<br />
R<br />
S<br />
Au<br />
Angle-resolved measurements<br />
A way to get more insight into the<br />
composition of a non-homogeneous<br />
sample is to measure a number of spectra<br />
at different measuring angles. Variation of<br />
the emission angle causes changes in the<br />
effective information depth of analysis. At<br />
glancing incidence (small angles) only the<br />
upper layers of the sample are examined;<br />
at high measuring angles deeper layers<br />
are detected. With respect to SAM<br />
layers angle-resolved measurements give<br />
qualitative information about the position<br />
of the sulphur in the layer. In figure 6 ratios<br />
are shown of the relative concentrations<br />
of different elements in a SAM layer,<br />
measured at different angles. The lower the<br />
concentration ratio the deeper the element<br />
is positioned in the sample. Obviously, the<br />
sulphur is closest to the Au substrate<br />
(see figure 5).<br />
R<br />
concentration ratio<br />
4<br />
3.5<br />
3<br />
2.5<br />
2<br />
1.5<br />
1<br />
0.5<br />
0<br />
Fig. 4: At the left a photograph of a pattern of gold<br />
lines in a biosensor is shown. These gold lines are<br />
present at different depths within the device. At<br />
the right the Au X-ray image of the same sensor<br />
is shown. Only the gold line on the upper surface<br />
shows up. This area is covered by a SAM layer.<br />
Model calculation<br />
For the analysis of multilayer systems,<br />
a model calculation method has been<br />
developed. With the model only one<br />
measurement at one measuring angle<br />
is needed to determine thickness and<br />
composition of each layer on the substrate.<br />
SAM layers on gold can be seen<br />
as multilayer systems due to their ordered<br />
structures. For such layers the model gives<br />
insight into the layer composition and allows<br />
the coverage of the gold with sulphur to be<br />
calculated (figure 7).<br />
Fig. 6: Concentrations measured at 25 and 45 degrees divided by the<br />
concentrations measured at 90 degrees for a SAM layer based on CH3 – O -<br />
(CH2 – CH2 – O) 3 – (CH2) 6 – SH on gold. The ratios (especially at 25 degrees)<br />
give a good idea about the position of the different elements in the sample. C<br />
and O are present in the top layer with O at the outer surface. S is closest to<br />
the Au substrate.<br />
20 40 60 80<br />
measuring angle (degrees)<br />
Au<br />
C<br />
O<br />
S