ε (eV)
ε (eV)
ε (eV)

You also want an ePaper? Increase the reach of your titles
YUMPU automatically turns print PDFs into web optimized ePapers that Google loves.
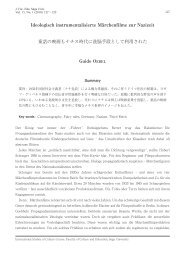
N/N 0<br />
1.0<br />
0.8<br />
0.6<br />
0.4<br />
0.2<br />
0.0<br />
0 2 4 6 8 10<br />
t (min)<br />
inactivation curve<br />
survival curve<br />
Figure 2.4: Time evolution of inactivated or survival bacteria during the inacti-<br />
vation process.<br />
k =<br />
nX<br />
ki. (2.10)<br />
i=1<br />
Consequently, the global D-value can be written as:<br />
1<br />
D =<br />
nX<br />
i=1<br />
1<br />
Di<br />
. (2.11)<br />
Usually, to quantify the destruction effects of an inactivation agent, survival<br />
or inactivation curves of the microorganism population is used [117, 118]. These<br />
are drawn both in Fig. 2.4. The survival curve (represented by continuous line)<br />
31