2020-09 -- Real Estate of Northern Virginia Market Report - September 2020 Market Trends - Michele Hudnall
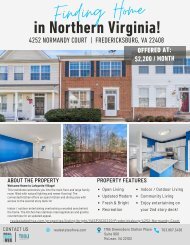
This is a monthly report of the Northern Virginia Real Estate market. Weekly I post a video of current market conditions and will post the monthly report between the 10th and 15th of each month as the numbers finalize in the MLS (Bright). The numbers come from the MLS (Bright), opinions are my own. This represents the market up to 5 Bedrooms keeping the numbers sub $1.5M and out of the luxury, custom market.
This is a monthly report of the Northern Virginia Real Estate market. Weekly I post a video of current market conditions and will post the monthly report between the 10th and 15th of each month as the numbers finalize in the MLS (Bright).
The numbers come from the MLS (Bright), opinions are my own. This represents the market up to 5 Bedrooms keeping the numbers sub $1.5M and out of the luxury, custom market.
- TAGS
- manassas-virginia
- falls-church-virginia
- alexandria-virginia
- arlington-virginia
- fauquier-county
- loudoun-county
- northern-virginia
- northern-virginia-real-estate
- prince-william-county
- fairfax-county
- northern-virginia-home-prices
- northern-virginia-home-trends
- nova-real-estate-trends
- nva-real-estate-trends
- michele-hudnall
- real-estate-of-nva

Create successful ePaper yourself
Turn your PDF publications into a flip-book with our unique Google optimized e-Paper software.
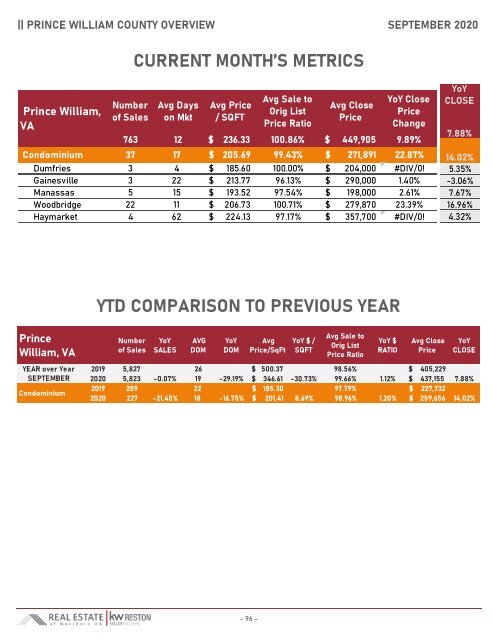
|| PRINCE WILLIAM COUNTY OVERVIEW SEPTEMBER <strong>2020</strong><br />
CURRENT MONTH’S METRICS<br />
Prince William,<br />
VA<br />
Number<br />
<strong>of</strong> Sales<br />
Avg Days<br />
on Mkt<br />
Avg Price<br />
/ SQFT<br />
Avg Sale to<br />
Orig List<br />
Price Ratio<br />
Avg Close<br />
Price<br />
YoY Close<br />
Price<br />
Change<br />
763 12 $ 236.33 100.86% $ 449,905 9.89%<br />
Condominium 37 17 $ 205.69 99.43% $ 271,891 22.87%<br />
Dumfries 3 4 $ 185.60 100.00% $ 204,000 #DIV/0!<br />
Gainesville 3 22 $ 213.77 96.13% $ 290,000 1.40%<br />
Manassas 5 15 $ 193.52 97.54% $ 198,000 2.61%<br />
Woodbridge 22 11 $ 206.73 100.71% $ 279,870 23.39%<br />
Haymarket 4 62 $ 224.13 97.17% $ 357,700 #DIV/0!<br />
YoY<br />
CLOSE<br />
7.88%<br />
14.02%<br />
5.35%<br />
-3.06%<br />
7.67%<br />
16.96%<br />
4.32%<br />
YTD COMPARISON TO PREVIOUS YEAR<br />
Prince<br />
William, VA<br />
YEAR over Year<br />
SEPTEMBER<br />
Condominium<br />
Number<br />
<strong>of</strong> Sales<br />
YoY<br />
SALES<br />
AVG<br />
DOM<br />
YoY<br />
DOM<br />
Avg<br />
Price/SqFt<br />
YoY $ /<br />
SQFT<br />
Avg Sale to<br />
Orig List<br />
Price Ratio<br />
YoY $<br />
RATIO<br />
Avg Close<br />
Price<br />
YoY<br />
CLOSE<br />
2019 5,827 26 $ 500.37 98.56% $ 405,229<br />
<strong>2020</strong> 5,823 -0.07% 19 -29.19% $ 346.61 -30.73% 99.66% 1.12% $ 437,155 7.88%<br />
2019 289 22 $ 185.30<br />
97.79% $ 227,732<br />
<strong>2020</strong> 227 -21.45% 18 -16.75% $ 201.41 8.69% 98.96% 1.20% $ 259,656 14.02%<br />
- 96 -