2020-09 -- Real Estate of Northern Virginia Market Report - September 2020 Market Trends - Michele Hudnall
This is a monthly report of the Northern Virginia Real Estate market. Weekly I post a video of current market conditions and will post the monthly report between the 10th and 15th of each month as the numbers finalize in the MLS (Bright). The numbers come from the MLS (Bright), opinions are my own. This represents the market up to 5 Bedrooms keeping the numbers sub $1.5M and out of the luxury, custom market.
This is a monthly report of the Northern Virginia Real Estate market. Weekly I post a video of current market conditions and will post the monthly report between the 10th and 15th of each month as the numbers finalize in the MLS (Bright).
The numbers come from the MLS (Bright), opinions are my own. This represents the market up to 5 Bedrooms keeping the numbers sub $1.5M and out of the luxury, custom market.
- TAGS
- manassas-virginia
- falls-church-virginia
- alexandria-virginia
- arlington-virginia
- fauquier-county
- loudoun-county
- northern-virginia
- northern-virginia-real-estate
- prince-william-county
- fairfax-county
- northern-virginia-home-prices
- northern-virginia-home-trends
- nova-real-estate-trends
- nva-real-estate-trends
- michele-hudnall
- real-estate-of-nva

Create successful ePaper yourself
Turn your PDF publications into a flip-book with our unique Google optimized e-Paper software.
SEPTEMBER <strong>2020</strong> NORTHERN VIRGINIA OVERVIEW ||<br />
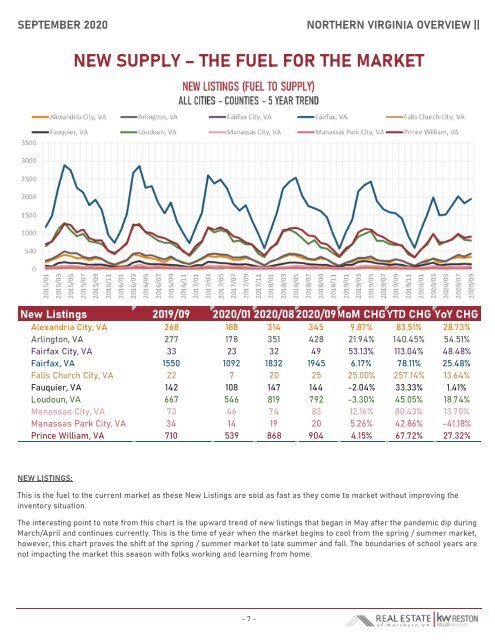
NEW SUPPLY – THE FUEL FOR THE MARKET<br />
New Listings 2019/<strong>09</strong> <strong>2020</strong>/01 <strong>2020</strong>/08<strong>2020</strong>/<strong>09</strong>MoM CHGYTD CHG YoY CHG<br />
Alexandria City, VA 268 188 314 345 9.87% 83.51% 28.73%<br />
Arlington, VA 277 178 351 428 21.94% 140.45% 54.51%<br />
Fairfax City, VA 33 23 32 49 53.13% 113.04% 48.48%<br />
Fairfax, VA 1550 1<strong>09</strong>2 1832 1945 6.17% 78.11% 25.48%<br />
Falls Church City, VA 22 7 20 25 25.00% 257.14% 13.64%<br />
Fauquier, VA 142 108 147 144 -2.04% 33.33% 1.41%<br />
Loudoun, VA 667 546 819 792 -3.30% 45.05% 18.74%<br />
Manassas City, VA 73 46 74 83 12.16% 80.43% 13.70%<br />
Manassas Park City, VA 34 14 19 20 5.26% 42.86% -41.18%<br />
Prince William, VA 710 539 868 904 4.15% 67.72% 27.32%<br />
NEW LISTINGS:<br />
This is the fuel to the current market as these New Listings are sold as fast as they come to market without improving the<br />
inventory situation.<br />
The interesting point to note from this chart is the upward trend <strong>of</strong> new listings that began in May after the pandemic dip during<br />
March/April and continues currently. This is the time <strong>of</strong> year when the market begins to cool from the spring / summer market,<br />
however, this chart proves the shift <strong>of</strong> the spring / summer market to late summer and fall. The boundaries <strong>of</strong> school years are<br />
not impacting the market this season with folks working and learning from home.<br />
- 7 -