2020-09 -- Real Estate of Northern Virginia Market Report - September 2020 Market Trends - Michele Hudnall
This is a monthly report of the Northern Virginia Real Estate market. Weekly I post a video of current market conditions and will post the monthly report between the 10th and 15th of each month as the numbers finalize in the MLS (Bright). The numbers come from the MLS (Bright), opinions are my own. This represents the market up to 5 Bedrooms keeping the numbers sub $1.5M and out of the luxury, custom market.
This is a monthly report of the Northern Virginia Real Estate market. Weekly I post a video of current market conditions and will post the monthly report between the 10th and 15th of each month as the numbers finalize in the MLS (Bright).
The numbers come from the MLS (Bright), opinions are my own. This represents the market up to 5 Bedrooms keeping the numbers sub $1.5M and out of the luxury, custom market.
- TAGS
- manassas-virginia
- falls-church-virginia
- alexandria-virginia
- arlington-virginia
- fauquier-county
- loudoun-county
- northern-virginia
- northern-virginia-real-estate
- prince-william-county
- fairfax-county
- northern-virginia-home-prices
- northern-virginia-home-trends
- nova-real-estate-trends
- nva-real-estate-trends
- michele-hudnall
- real-estate-of-nva

Create successful ePaper yourself
Turn your PDF publications into a flip-book with our unique Google optimized e-Paper software.
SEPTEMBER <strong>2020</strong> NORTHERN VIRGINIA OVERVIEW ||<br />
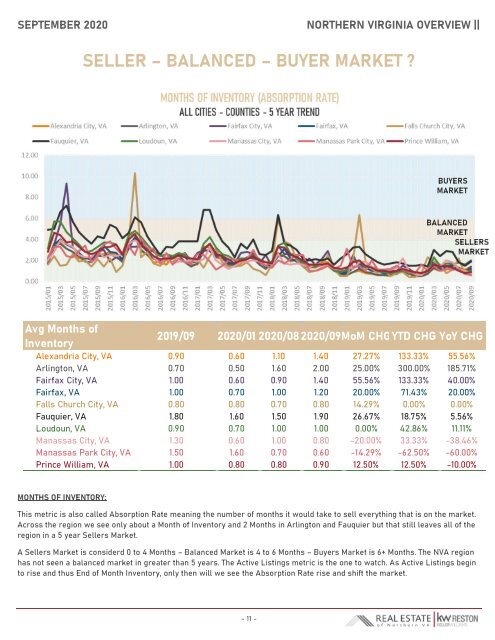
SELLER – BALANCED – BUYER MARKET ?<br />
BUYERS<br />
MARKET<br />
BALANCED<br />
MARKET<br />
SELLERS<br />
MARKET<br />
Avg Months <strong>of</strong><br />
Inventory<br />
2019/<strong>09</strong> <strong>2020</strong>/01 <strong>2020</strong>/08<strong>2020</strong>/<strong>09</strong>MoM CHGYTD CHG YoY CHG<br />
Alexandria City, VA 0.90 0.60 1.10 1.40 27.27% 133.33% 55.56%<br />
Arlington, VA 0.70 0.50 1.60 2.00 25.00% 300.00% 185.71%<br />
Fairfax City, VA 1.00 0.60 0.90 1.40 55.56% 133.33% 40.00%<br />
Fairfax, VA 1.00 0.70 1.00 1.20 20.00% 71.43% 20.00%<br />
Falls Church City, VA 0.80 0.80 0.70 0.80 14.29% 0.00% 0.00%<br />
Fauquier, VA 1.80 1.60 1.50 1.90 26.67% 18.75% 5.56%<br />
Loudoun, VA 0.90 0.70 1.00 1.00 0.00% 42.86% 11.11%<br />
Manassas City, VA 1.30 0.60 1.00 0.80 -20.00% 33.33% -38.46%<br />
Manassas Park City, VA 1.50 1.60 0.70 0.60 -14.29% -62.50% -60.00%<br />
Prince William, VA 1.00 0.80 0.80 0.90 12.50% 12.50% -10.00%<br />
MONTHS OF INVENTORY:<br />
This metric is also called Absorption Rate meaning the number <strong>of</strong> months it would take to sell everything that is on the market.<br />
Across the region we see only about a Month <strong>of</strong> Inventory and 2 Months in Arlington and Fauquier but that still leaves all <strong>of</strong> the<br />
region in a 5 year Sellers <strong>Market</strong>.<br />
A Sellers <strong>Market</strong> is considerd 0 to 4 Months – Balanced <strong>Market</strong> is 4 to 6 Months – Buyers <strong>Market</strong> is 6+ Months. The NVA region<br />
has not seen a balanced market in greater than 5 years. The Active Listings metric is the one to watch. As Active Listings begin<br />
to rise and thus End <strong>of</strong> Month Inventory, only then will we see the Absorption Rate rise and shift the market.<br />
- 11 -