2020-09 -- Real Estate of Northern Virginia Market Report - September 2020 Market Trends - Michele Hudnall
This is a monthly report of the Northern Virginia Real Estate market. Weekly I post a video of current market conditions and will post the monthly report between the 10th and 15th of each month as the numbers finalize in the MLS (Bright). The numbers come from the MLS (Bright), opinions are my own. This represents the market up to 5 Bedrooms keeping the numbers sub $1.5M and out of the luxury, custom market.
This is a monthly report of the Northern Virginia Real Estate market. Weekly I post a video of current market conditions and will post the monthly report between the 10th and 15th of each month as the numbers finalize in the MLS (Bright).
The numbers come from the MLS (Bright), opinions are my own. This represents the market up to 5 Bedrooms keeping the numbers sub $1.5M and out of the luxury, custom market.
- TAGS
- manassas-virginia
- falls-church-virginia
- alexandria-virginia
- arlington-virginia
- fauquier-county
- loudoun-county
- northern-virginia
- northern-virginia-real-estate
- prince-william-county
- fairfax-county
- northern-virginia-home-prices
- northern-virginia-home-trends
- nova-real-estate-trends
- nva-real-estate-trends
- michele-hudnall
- real-estate-of-nva

Create successful ePaper yourself
Turn your PDF publications into a flip-book with our unique Google optimized e-Paper software.
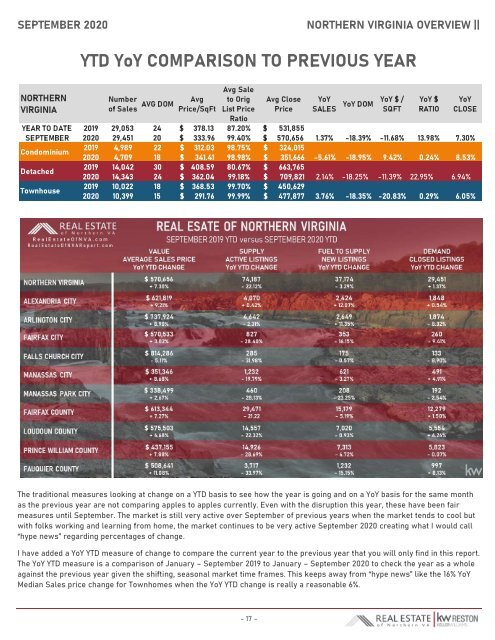
SEPTEMBER <strong>2020</strong> NORTHERN VIRGINIA OVERVIEW ||<br />
YTD YoY COMPARISON TO PREVIOUS YEAR<br />
NORTHERN<br />
VIRGINIA<br />
YEAR TO DATE<br />
SEPTEMBER<br />
Condominium<br />
Detached<br />
Townhouse<br />
Number<br />
<strong>of</strong> Sales<br />
AVG DOM<br />
Avg<br />
Price/SqFt<br />
Avg Sale<br />
to Orig<br />
List Price<br />
Ratio<br />
Avg Close<br />
Price<br />
YoY<br />
SALES<br />
YoY DOM<br />
YoY $ /<br />
SQFT<br />
YoY $<br />
RATIO<br />
YoY<br />
CLOSE<br />
2019 29,053 24 $ 378.13 87.20% $ 531,855<br />
<strong>2020</strong> 29,451 20 $ 333.96 99.40% $ 570,656 1.37% -18.39% -11.68% 13.98% 7.30%<br />
2019 4,989 22 $ 312.03 98.75% $ 324,015<br />
<strong>2020</strong> 4,7<strong>09</strong> 18 $ 341.41 98.98% $ 351,666 -5.61% -18.95% 9.42% 0.24% 8.53%<br />
2019 14,042 30 $ 408.59 80.67% $ 663,765<br />
<strong>2020</strong> 14,343 24 $ 362.04 99.18% $ 7<strong>09</strong>,821 2.14% -18.25% -11.39% 22.95% 6.94%<br />
2019 10,022 18 $ 368.53 99.70% $ 450,629<br />
<strong>2020</strong> 10,399 15 $ 291.76 99.99% $ 477,877 3.76% -18.35% -20.83% 0.29% 6.05%<br />
The traditional measures looking at change on a YTD basis to see how the year is going and on a YoY basis for the same month<br />
as the previous year are not comparing apples to apples currently. Even with the disruption this year, these have been fair<br />
measures until <strong>September</strong>. The market is still very active over <strong>September</strong> <strong>of</strong> previous years when the market tends to cool but<br />
with folks working and learning from home, the market continues to be very active <strong>September</strong> <strong>2020</strong> creating what I would call<br />
“hype news” regarding percentages <strong>of</strong> change.<br />
I have added a YoY YTD measure <strong>of</strong> change to compare the current year to the previous year that you will only find in this report.<br />
The YoY YTD measure is a comparison <strong>of</strong> January – <strong>September</strong> 2019 to January – <strong>September</strong> <strong>2020</strong> to check the year as a whole<br />
against the previous year given the shifting, seasonal market time frames. This keeps away from “hype news” like the 16% YoY<br />
Median Sales price change for Townhomes when the YoY YTD change is really a reasonable 6%.<br />
- 17 -