2020-09 -- Real Estate of Northern Virginia Market Report - September 2020 Market Trends - Michele Hudnall
This is a monthly report of the Northern Virginia Real Estate market. Weekly I post a video of current market conditions and will post the monthly report between the 10th and 15th of each month as the numbers finalize in the MLS (Bright). The numbers come from the MLS (Bright), opinions are my own. This represents the market up to 5 Bedrooms keeping the numbers sub $1.5M and out of the luxury, custom market.
This is a monthly report of the Northern Virginia Real Estate market. Weekly I post a video of current market conditions and will post the monthly report between the 10th and 15th of each month as the numbers finalize in the MLS (Bright).
The numbers come from the MLS (Bright), opinions are my own. This represents the market up to 5 Bedrooms keeping the numbers sub $1.5M and out of the luxury, custom market.
- TAGS
- manassas-virginia
- falls-church-virginia
- alexandria-virginia
- arlington-virginia
- fauquier-county
- loudoun-county
- northern-virginia
- northern-virginia-real-estate
- prince-william-county
- fairfax-county
- northern-virginia-home-prices
- northern-virginia-home-trends
- nova-real-estate-trends
- nva-real-estate-trends
- michele-hudnall
- real-estate-of-nva

Create successful ePaper yourself
Turn your PDF publications into a flip-book with our unique Google optimized e-Paper software.
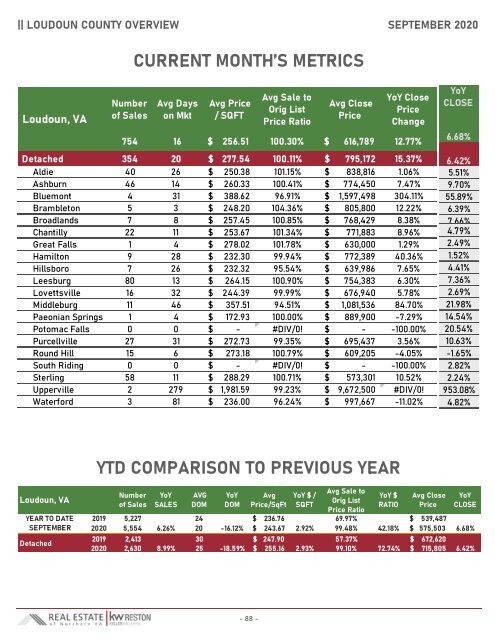
|| LOUDOUN COUNTY OVERVIEW SEPTEMBER <strong>2020</strong><br />
CURRENT MONTH’S METRICS<br />
Loudoun, VA<br />
Number<br />
<strong>of</strong> Sales<br />
Avg Days<br />
on Mkt<br />
Avg Price<br />
/ SQFT<br />
Avg Sale to<br />
Orig List<br />
Price Ratio<br />
Avg Close<br />
Price<br />
YoY Close<br />
Price<br />
Change<br />
754 16 $ 256.51 100.30% $ 616,789 12.77%<br />
Detached 354 20 $ 277.54 100.11% $ 795,172 15.37%<br />
Aldie 40 26 $ 250.38 101.15% $ 838,816 1.06%<br />
Ashburn 46 14 $ 260.33 100.41% $ 774,450 7.47%<br />
Bluemont 4 31 $ 388.62 96.91% $ 1,597,498 304.11%<br />
Brambleton 5 3 $ 248.20 104.36% $ 805,800 12.22%<br />
Broadlands 7 8 $ 257.45 100.85% $ 768,429 8.38%<br />
Chantilly 22 11 $ 253.67 101.34% $ 771,883 8.96%<br />
Great Falls 1 4 $ 278.02 101.78% $ 630,000 1.29%<br />
Hamilton 9 28 $ 232.30 99.94% $ 772,389 40.36%<br />
Hillsboro 7 26 $ 232.32 95.54% $ 639,986 7.65%<br />
Leesburg 80 13 $ 264.15 100.90% $ 754,383 6.30%<br />
Lovettsville 16 32 $ 244.39 99.99% $ 676,940 5.78%<br />
Middleburg 11 46 $ 357.51 94.51% $ 1,081,536 84.70%<br />
Paeonian Springs 1 4 $ 172.93 100.00% $ 889,900 -7.29%<br />
Potomac Falls 0 0 $ - #DIV/0! $ - -100.00%<br />
Purcellville 27 31 $ 272.73 99.35% $ 695,437 3.56%<br />
Round Hill 15 6 $ 273.18 100.79% $ 6<strong>09</strong>,205 -4.05%<br />
South Riding 0 0 $ - #DIV/0! $ - -100.00%<br />
Sterling 58 11 $ 288.29 100.71% $ 573,301 10.52%<br />
Upperville 2 279 $ 1,981.59 99.23% $ 9,672,500 #DIV/0!<br />
Waterford 3 81 $ 236.00 96.24% $ 997,667 -11.02%<br />
YoY<br />
CLOSE<br />
6.68%<br />
6.42%<br />
5.51%<br />
9.70%<br />
55.89%<br />
6.39%<br />
7.66%<br />
4.79%<br />
2.49%<br />
1.52%<br />
4.41%<br />
7.36%<br />
2.69%<br />
21.98%<br />
14.54%<br />
20.54%<br />
10.63%<br />
-1.65%<br />
2.82%<br />
2.24%<br />
953.08%<br />
4.82%<br />
Loudoun, VA<br />
YTD COMPARISON TO PREVIOUS YEAR<br />
Number<br />
<strong>of</strong> Sales<br />
YoY<br />
SALES<br />
AVG<br />
DOM<br />
YoY<br />
DOM<br />
Avg<br />
Price/SqFt<br />
YoY $ /<br />
SQFT<br />
Avg Sale to<br />
Orig List<br />
Price Ratio<br />
YoY $<br />
RATIO<br />
Avg Close<br />
Price<br />
YoY<br />
CLOSE<br />
YEAR TO DATE 2019 5,227 24 $ 236.76 69.97% $ 539,487<br />
SEPTEMBER <strong>2020</strong> 5,554 436 -2.90% 6.26% 20 22 -16.12% -1.81% $ 243.67 249.18 5.75% 2.92% 99.48% 98.65% -0.08% 42.18% $ 575,503 313,994 6.68% 5.68%<br />
Detached<br />
2019 2,413 30 $ 247.90<br />
57.37% $ 672,620<br />
<strong>2020</strong> 2,630 8.99% 25 -18.59% $ 255.16 2.93% 99.10% 72.74% $ 715,805 6.42%<br />
- 88 -