Annual Report 2009 - Ecco
Annual Report 2009 - Ecco
Annual Report 2009 - Ecco

Create successful ePaper yourself
Turn your PDF publications into a flip-book with our unique Google optimized e-Paper software.
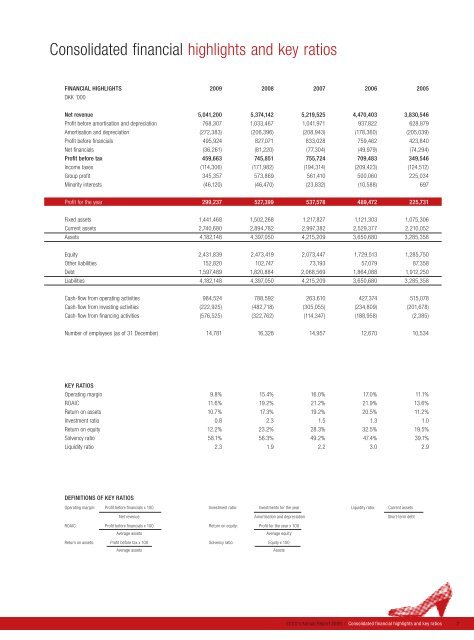
Consolidated financial highlights and key ratios<br />
FINANCIAL HIGHLIGHTS <strong>2009</strong> 2008 2007 2006 2005<br />
DKK ’000<br />
Net revenue 5,041,200 5,374,142 5,219,525 4,470,403 3,830,546<br />
Profit before amortisation and depreciation 768,307 1,033,467 1,041,971 937,822 628,879<br />
Amortisation and depreciation (272,383) (206,396) (208,943) (178,360) (205,039)<br />
Profit before financials 495,924 827,071 833,028 759,462 423,840<br />
Net financials (36,261) (81,220) (77,304) (49,979) (74,294)<br />
Profit before tax 459,663 745,851 755,724 709,483 349,546<br />
Income taxes (114,306) (171,982) (194,314) (209,423) (124,512)<br />
Group profit 345,357 573,869 561,410 500,060 225,034<br />
Minority interests (46,120) (46,470) (23,832) (10,588) 697<br />
Profit for the year 299,237 527,399 537,578 489,472 225,731<br />
Fixed assets 1,441,468 1,502,268 1,217,827 1,121,303 1,075,306<br />
Current assets 2,740,680 2,894,782 2,997,382 2,529,377 2,210,052<br />
Assets 4,182,148 4,397,050 4,215,209 3,650,680 3,285,358<br />
Equity 2,431,839 2,473,419 2,073,447 1,729,513 1,285,750<br />
Other liabilities 152,820 102,747 73,193 57,079 87,358<br />
Debt 1,597,489 1,820,884 2,068,569 1,864,088 1,912,250<br />
Liabilities 4,182,148 4,397,050 4,215,209 3,650,680 3,285,358<br />
Cash-flow from operating activities 984,524 788,592 263,610 427,374 515,078<br />
Cash-flow from investing activities (222,925) (482,718) (305,055) (234,809) (201,678)<br />
Cash-flow from financing activities (576,525) (322,762) (114,347) (188,958) (2,385)<br />
Number of employees (as of 31 December) 14,781 16,328 14,957 12,670 10,534<br />
KEY RATIOS<br />
Operating margin 9.8% 15.4% 16.0% 17.0% 11.1%<br />
ROAIC 11.6% 19.2% 21.2% 21.9% 13.6%<br />
Return on assets 10.7% 17.3% 19.2% 20.5% 11.2%<br />
Investment ratio 0.8 2.3 1.5 1.3 1.0<br />
Return on equity 12.2% 23.2% 28.3% 32.5% 19.5%<br />
Solvency ratio 58.1% 56.3% 49.2% 47.4% 39.1%<br />
Liquidity ratio 2.3 1.9 2.2 3.0 2.9<br />
DEFINITIONS OF KEY RATIOS<br />
Operating margin: Profit before financials x 100 Investment ratio: Investments for the year Liquidity ratio: Current assets<br />
Net revenue Amortisation and depreciation Short-term debt<br />
ROAIC: Profit before financials x 100 Return on equity: Profit for the year x 100<br />
Average assets Average equity<br />
Return on assets: Profit before tax x 100 Solvency ratio: Equity x 100<br />
Average assets Assets<br />
ECCO’s <strong>Annual</strong> <strong>Report</strong> <strong>2009</strong> / Consolidated financial highlights and key ratios 7