Jan-Feb-Mar 2021

You also want an ePaper? Increase the reach of your titles
YUMPU automatically turns print PDFs into web optimized ePapers that Google loves.
PRODUCTREVIEW<br />
SolarWinds Database<br />
Performance<br />
Analyzer<br />
PRODUCT REVIEW<br />
PRODUCT<br />
REVIEWPRODUCT RE<br />
Databases are so critical to business<br />
operations that it's essential their health,<br />
availability and performance are<br />
assured. Problems with databases and their host<br />
systems are notoriously difficult to identify and<br />
diagnose and can easily manifest themselves<br />
when it's too late to stop them impacting on<br />
customer services.<br />
To ensure smooth database operations,<br />
businesses need a proactive monitoring solution<br />
and the SolarWinds Database Performance<br />
Analyzer (DPA) provides a wealth of features.<br />
Supporting all main cloud, on-premises and<br />
virtualised database platforms, DPA offers deep<br />
insights into performance and resource usage,<br />
identifies anomalies and their root causes and<br />
provides sage advice on remedial actions.<br />
We found DPA easy to deploy and had it<br />
running on a Windows Server 2019 host in<br />
under 30 minutes. It provides a handy web<br />
browser wizard that helps create a performance<br />
data repository, and offers facilities to register<br />
individual database instances or multiple ones<br />
at the same time.<br />
A key feature of DPA is its agentless<br />
monitoring while larger organisations will<br />
approve of its support for SQL Server<br />
availability groups (AGs) plus Oracle's<br />
multitenant container databases (CDBs). At its<br />
foundation, DPA uses the proven Response<br />
Time Analysis method to measure the wait time<br />
between query requests and responses.<br />
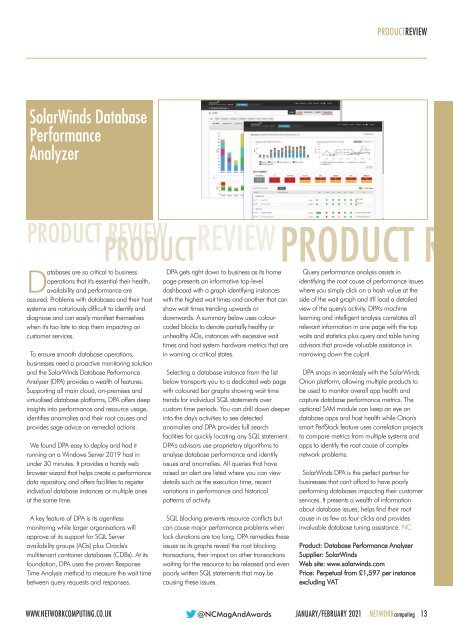
DPA gets right down to business as its home<br />
page presents an informative top-level<br />
dashboard with a graph identifying instances<br />
with the highest wait times and another that can<br />
show wait times trending upwards or<br />
downwards. A summary below uses colourcoded<br />
blocks to denote partially healthy or<br />
unhealthy AGs, instances with excessive wait<br />
times and host system hardware metrics that are<br />
in warning or critical states.<br />
Selecting a database instance from the list<br />
below transports you to a dedicated web page<br />
with coloured bar graphs showing wait time<br />
trends for individual SQL statements over<br />
custom time periods. You can drill down deeper<br />
into the day's activities to see detected<br />
anomalies and DPA provides full search<br />
facilities for quickly locating any SQL statement.<br />
DPA's advisors use proprietary algorithms to<br />
analyse database performance and identify<br />
issues and anomalies. All queries that have<br />
raised an alert are listed where you can view<br />
details such as the execution time, recent<br />
variations in performance and historical<br />
patterns of activity.<br />
SQL blocking prevents resource conflicts but<br />
can cause major performance problems when<br />
lock durations are too long. DPA remedies these<br />
issues as its graphs reveal the root blocking<br />
transactions, their impact on other transactions<br />
waiting for the resource to be released and even<br />
poorly written SQL statements that may be<br />
causing these issues.<br />
Query performance analysis assists in<br />
identifying the root cause of performance issues<br />
where you simply click on a hash value at the<br />
side of the wait graph and it'll load a detailed<br />
view of the query's activity. DPA's machine<br />
learning and intelligent analysis correlates all<br />
relevant information in one page with the top<br />
waits and statistics plus query and table tuning<br />
advisors that provide valuable assistance in<br />
narrowing down the culprit.<br />
DPA snaps in seamlessly with the SolarWinds<br />
Orion platform, allowing multiple products to<br />
be used to monitor overall app health and<br />
capture database performance metrics. The<br />
optional SAM module can keep an eye on<br />
database apps and host health while Orion's<br />
smart PerfStack feature uses correlation projects<br />
to compare metrics from multiple systems and<br />
apps to identify the root cause of complex<br />
network problems.<br />
SolarWinds DPA is the perfect partner for<br />
businesses that can't afford to have poorly<br />
performing databases impacting their customer<br />
services. It presents a wealth of information<br />
about database issues, helps find their root<br />
cause in as few as four clicks and provides<br />
invaluable database tuning assistance. NC<br />
Product: Database Performance Analyzer<br />
Supplier: SolarWinds<br />
Web site: www.solarwinds.com<br />
Price: Perpetual from £1,597 per instance<br />
excluding VAT<br />
WWW.NETWORKCOMPUTING.CO.UK @NCMagAndAwards JANUARY/FEBRUARY <strong>2021</strong> NETWORKcomputing 13