Climate change action plan 2021-23
Climate change action plan 2021-23
Climate change action plan 2021-23

You also want an ePaper? Increase the reach of your titles
YUMPU automatically turns print PDFs into web optimized ePapers that Google loves.
INTRODUCTION<br />
Positive CO 2<br />
Emissions in Northumberland<br />
The primary contributor to global climate <strong>change</strong> is carbon dioxide<br />
(CO 2<br />
) emitted into the atmosphere from burning fossil fuels to<br />
create energy. The primary uses of this energy and therefore the<br />
primary sources of CO 2<br />
emissions in Northumberland are transport,<br />
heat and power.<br />
Northumberland County Council uses figures published<br />
annually by the Department for Business, Energy and<br />
Industrial Strategy (BEIS) to monitor CO 2<br />
emissions for<br />
the county of Northumberland. The most recent figures<br />
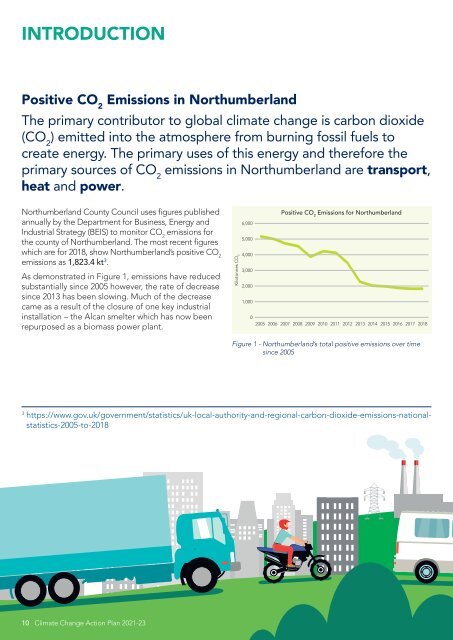
which are for 2018, show Northumberland’s positive CO 2<br />
emissions as 1,8<strong>23</strong>.4 kt 3 .<br />
As demonstrated in Figure 1, emissions have reduced<br />
substantially since 2005 however, the rate of decrease<br />
since 2013 has been slowing. Much of the decrease<br />
came as a result of the closure of one key industrial<br />
installation – the Alcan smelter which has now been<br />
repurposed as a biomass power <strong>plan</strong>t.<br />
Kilotonnes CO 2<br />
Positive CO 2<br />
Emissions for Northumberland<br />
6,000<br />
5,000<br />
4,000<br />
3,000<br />
2,000<br />
1,000<br />
0<br />
2005 2006 2007 2008 2009 2010 2011 2012 2013 2014 2015 2016 2017 2018<br />
Figure 1 - Northumberland’s total positive emissions over time<br />
since 2005<br />
3<br />
https://www.gov.uk/government/statistics/uk-local-authority-and-regional-carbon-dioxide-emissions-nationalstatistics-2005-to-2018<br />
10<br />
<strong>Climate</strong> Change Action Plan <strong>2021</strong>-<strong>23</strong>