Boxoffice Pro Q1 2021
Boxoffice Pro is the official publication of the National Association of Theatre Owners.
Boxoffice Pro is the official publication of the National Association of Theatre Owners.

You also want an ePaper? Increase the reach of your titles
YUMPU automatically turns print PDFs into web optimized ePapers that Google loves.
Does streaming finally spell the end<br />
of cinema? It is the question many<br />
theatrical exhibition professionals are<br />
asking themselves with greater urgency,<br />
thanks to a newly shortened theatrical<br />
exclusivity window and studios rushing<br />
to get their films on home entertainment<br />
platforms as quickly as possible during the<br />
coronavirus pandemic.<br />
Driven by these concerns, a team from<br />
the University of Memphis Kemmons<br />
Wilson School of Hospitality and Resort<br />
Management, under the leadership<br />
of Radesh Palakurthi, PhD, MBA, and<br />
commissioned by Larry Etter, director of<br />
education for the National Association<br />
of Concessionaires, compiled research<br />
on audiences’ streaming and moviegoing<br />
preferences and habits to determine<br />
the potential impact of streaming on<br />
moviegoing.<br />
Palakurthi enlisted the support of<br />
Qualtrics, a globally recognized survey<br />
facilitator, to assist in the study. The<br />
survey was performed in 2019, before<br />
Covid-19 shutdowns, allowing for a<br />
fair comparison between streaming<br />
and moviegoing. The survey offered 35<br />
statements comparing streaming services<br />
with movie theaters on a 5-point Likert<br />
Scale (1 = strongly agree to 5 = strongly<br />
disagree). A factor analysis was used<br />
to reduce the 35 statements to core<br />
constructs for in-depth study. There were<br />
420 usable responses (as determined by<br />
Qualtrics).<br />
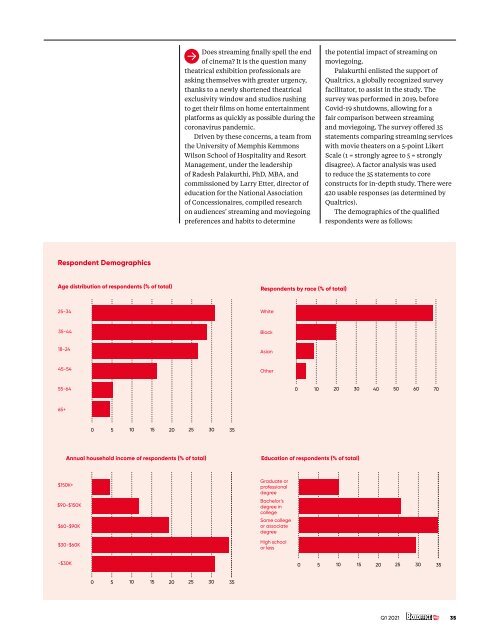
The demographics of the qualified<br />
respondents were as follows:<br />
Respondent Demographics<br />
Age distribution of respondents (% of total)<br />
Respondents by race (% of total)<br />
25-34 White<br />
35-44<br />
Black<br />
18-24<br />
Asian<br />
45-54<br />
Other<br />
55-64<br />
0<br />
10<br />
20<br />
30<br />
40<br />
50<br />
60<br />
70<br />
65+<br />
0 5 10 15 20 25 30 35<br />
Annual household income of respondents (% of total)<br />
Education of respondents (% of total)<br />
$150K+<br />
$90-$150K<br />
$60-$90K<br />
$30-$60K<br />
Graduate or<br />
professional<br />
degree<br />
Bachelor’s<br />
degree in<br />
college<br />
Some college<br />
or associate<br />
degree<br />
High school<br />
or less<br />
-$30K<br />
0<br />
5<br />
10<br />
15<br />
20<br />
25<br />
30<br />
35<br />
0<br />
5<br />
10<br />
15<br />
20<br />
25<br />
30<br />
35<br />
<strong>Q1</strong> <strong>2021</strong><br />
35