

Evidence base and patients' perspective - World Journal of ...
Evidence base and patients' perspective - World Journal of ...
Evidence base and patients' perspective - World Journal of ...

You also want an ePaper? Increase the reach of your titles
YUMPU automatically turns print PDFs into web optimized ePapers that Google loves.
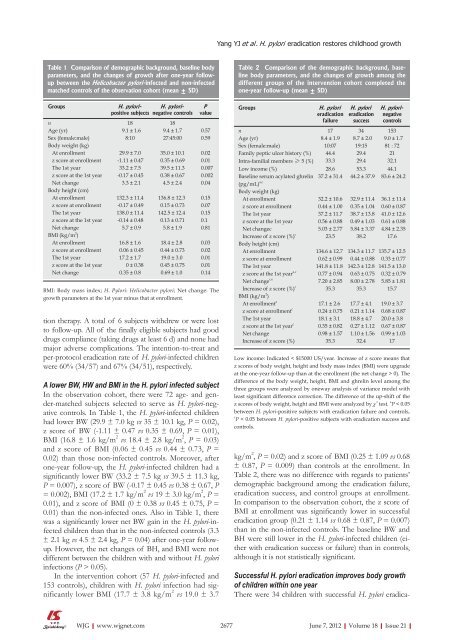
Table 1 Comparison <strong>of</strong> demographic background, <strong>base</strong>line body<br />
parameters, <strong>and</strong> the changes <strong>of</strong> growth after one-year followup<br />
between the Helicobacter pylori -infected <strong>and</strong> non-infected<br />
matched controls <strong>of</strong> the observation cohort (mean ± SD)<br />
Groups H. pylori -<br />
positive subjects<br />
tion therapy. A total <strong>of</strong> 6 subjects withdrew or were lost<br />
to follow-up. All <strong>of</strong> the finally eligible subjects had good<br />
drugs compliance (taking drugs at least 6 d) <strong>and</strong> none had<br />
major adverse complications. The intention-to-treat <strong>and</strong><br />
per-protocol eradication rate <strong>of</strong> H. pylori-infected children<br />
were 60% (34/57) <strong>and</strong> 67% (34/51), respectively.<br />
A lower BW, HW <strong>and</strong> BMI in the H. pylori infected subject<br />
In the observation cohort, there were 72 age- <strong>and</strong> gender-matched<br />
subjects selected to serve as H. pylori-negative<br />
controls. In Table 1, the H. pylori-infected children<br />
had lower BW (29.9 ± 7.0 kg vs 35 ± 10.1 kg, P = 0.02),<br />
z score <strong>of</strong> BW (-1.11 ± 0.47 vs 0.35 ± 0.69, P = 0.01),<br />
BMI (16.8 ± 1.6 kg/m 2 vs 18.4 ± 2.8 kg/m 2 , P = 0.03)<br />
<strong>and</strong> z score <strong>of</strong> BMI (0.06 ± 0.45 vs 0.44 ± 0.73, P =<br />
0.02) than those non-infected controls. Moreover, after<br />
one-year follow-up, the H. pylori-infected children had a<br />
significantly lower BW (33.2 ± 7.5 kg vs 39.5 ± 11.3 kg,<br />
P = 0.007), z score <strong>of</strong> BW (-0.17 ± 0.45 vs 0.38 ± 0.67, P<br />
= 0.002), BMI (17.2 ± 1.7 kg/m 2 vs 19 ± 3.0 kg/m 2 , P =<br />
0.01), <strong>and</strong> z score <strong>of</strong> BMI (0 ± 0.38 vs 0.45 ± 0.75, P =<br />
0.01) than the non-infected ones. Also in Table 1, there<br />
was a significantly lower net BW gain in the H. pylori-infected<br />
children than that in the non-infected controls (3.3<br />
± 2.1 kg vs 4.5 ± 2.4 kg, P = 0.04) after one-year followup.<br />
However, the net changes <strong>of</strong> BH, <strong>and</strong> BMI were not<br />
different between the children with <strong>and</strong> without H. pylori<br />
infections (P > 0.05).<br />
In the intervention cohort (57 H. pylori-infected <strong>and</strong><br />
153 controls), children with H. pylori infection had significantly<br />
lower BMI (17.7 ± 3.8 kg/m 2 vs 19.0 ± 3.7<br />
WJG|www.wjgnet.com<br />
H. pylori -<br />
negative controls<br />
P<br />
value<br />
n 18 18<br />
Age (yr) 9.1 ± 1.6 9.4 ± 1.7 0.57<br />
Sex (female:male) 8:10 27:45:00 0.59<br />
Body weight (kg)<br />
At enrollment 29.9 ± 7.0 35.0 ± 10.1 0.02<br />
z score at enrollment -1.11 ± 0.47 0.35 ± 0.69 0.01<br />
The 1st year 33.2 ± 7.5 39.5 ± 11.3 0.007<br />
z score at the 1st year -0.17 ± 0.45 0.38 ± 0.67 0.002<br />
Net change 3.3 ± 2.1 4.5 ± 2.4 0.04<br />
Body height (cm)<br />
At enrollment 132.3 ± 11.4 136.8 ± 12.3 0.15<br />
z score at enrollment -0.17 ± 0.49 0.15 ± 0.73 0.07<br />
The 1st year 138.0 ± 11.4 142.5 ± 12.4 0.15<br />
z score at the 1st year -0.14 ± 0.48 0.13 ± 0.71 0.1<br />
Net change 5.7 ± 0.9 5.8 ± 1.9 0.81<br />
BMI (kg/m 2 )<br />
At enrollment 16.8 ± 1.6 18.4 ± 2.8 0.03<br />
z score at enrollment 0.06 ± 0.45 0.44 ± 0.73 0.02<br />
The 1st year 17.2 ± 1.7 19.0 ± 3.0 0.01<br />
z score at the 1st year 0 ± 0.38 0.45 ± 0.75 0.01<br />
Net change 0.35 ± 0.8 0.69 ± 1.0 0.14<br />
BMI: Body mass index; H. Pylori: Helicobacter pylori; Net change: The<br />
growth parameters at the 1st year minus that at enrollment.<br />
Yang YJ et al . H. pylori eradication restores childhood growth<br />
Table 2 Comparison <strong>of</strong> the demographic background, <strong>base</strong>line<br />
body parameters, <strong>and</strong> the changes <strong>of</strong> growth among the<br />
different groups <strong>of</strong> the intervention cohort completed the<br />
one-year follow-up (mean ± SD)<br />
Groups H. pylori<br />
eradication<br />
failure<br />
H. pylori<br />
eradication<br />
success<br />
H. pylori -<br />
negative<br />
controls<br />
n 17 34 153<br />
Age (yr) 8.4 ± 1.9 8.7 ± 2.0 9.0 ± 1.7<br />
Sex (female:male) 10:07 19:15 81 : 72<br />
Family peptic ulcer history (%) 44.4 29.4 21<br />
Intra-familial members ≥ 5 (%) 33.3 29.4 32.1<br />
Low income (%) 28.6 53.3 44.1<br />
Baseline serum acylated ghrelin<br />
(pg/mL) a,c<br />
Body weight (kg)<br />
37.2 ± 31.4 44.2 ± 37.9 83.6 ± 24.2<br />
At enrollment 32.2 ± 10.6 32.9 ± 11.4 36.1 ± 11.4<br />
z score at enrollment 0.44 ± 1.00 0.35 ± 1.04 0.60 ± 0.87<br />
The 1st year 37.2 ± 11.7 38.7 ± 13.8 41.0 ± 12.6<br />
z score at the 1st year 0.56 ± 0.88 0.49 ± 1.03 0.61 ± 0.88<br />
Net changec 5.03 ± 2.77 5.84 ± 3.37 4.84 ± 2.35<br />
Increase <strong>of</strong> z score (%) c<br />
Body height (cm)<br />
23.5 38.2 17.6<br />
At enrollment 134.6 ± 12.7 134.3 ± 11.7 135.7 ± 12.5<br />
z score at enrollment 0.62 ± 0.99 0.44 ± 0.88 0.33 ± 0.77<br />
The 1st year 141.8 ± 11.8 142.3 ± 12.8 141.5 ± 13.0<br />
z score at the 1st year a,c<br />
0.77 ± 0.94 0.63 ± 0.75 0.32 ± 0.79<br />
Net change c,e<br />
7.20 ± 2.85 8.00 ± 2.78 5.85 ± 1.81<br />
Increase <strong>of</strong> z score (%) c<br />
BMI (kg/m<br />
35.3 35.3 15.7<br />
2 )<br />
At enrollment a<br />
17.1 ± 2.6 17.7 ± 4.1 19.0 ± 3.7<br />
z score at enrollment c<br />
0.24 ± 0.75 0.21 ± 1.14 0.68 ± 0.87<br />
The 1st year 18.1 ± 3.1 18.8 ± 4.7 20.0 ± 3.8<br />
z score at the 1st year c<br />
0.35 ± 0.82 0.27 ± 1.12 0.67 ± 0.87<br />
Net change 0.98 ± 1.57 1.10 ± 1.56 0.99 ± 1.03<br />
Increase <strong>of</strong> z score (%) 35.3 32.4 17<br />
Low income: Indicated < $15000 US/year. Increase <strong>of</strong> z score means that<br />
z scores <strong>of</strong> body weight, height <strong>and</strong> body mass index (BMI) were upgrade<br />
at the one-year follow-up than at the enrollment (the net change > 0). The<br />
difference <strong>of</strong> the body weight, height, BMI <strong>and</strong> ghrelin level among the<br />
three groups were analyzed by oneway analysis <strong>of</strong> variance model with<br />
least significant difference correction. The difference <strong>of</strong> the up-shift <strong>of</strong> the<br />
z scores <strong>of</strong> body weight, height <strong>and</strong> BMI were analyzed by χ 2 test. a P < 0.05<br />
between H. pylori-positive subjects with eradication failure <strong>and</strong> controls,<br />
c P < 0.05 between H. pylori-positive subjects with eradication success <strong>and</strong><br />
controls.<br />
kg/m 2 , P = 0.02) <strong>and</strong> z score <strong>of</strong> BMI (0.25 ± 1.09 vs 0.68<br />
± 0.87, P = 0.009) than controls at the enrollment. In<br />
Table 2, there was no difference with regards to patients’<br />
demographic background among the eradication failure,<br />
eradication success, <strong>and</strong> control groups at enrollment.<br />
In comparison to the observation cohort, the z score <strong>of</strong><br />
BMI at enrollment was significantly lower in successful<br />
eradication group (0.21 ± 1.14 vs 0.68 ± 0.87, P = 0.007)<br />
than in the non-infected controls. The <strong>base</strong>line BW <strong>and</strong><br />
BH were still lower in the H. pylori-infected children (either<br />
with eradication success or failure) than in controls,<br />
although it is not statistically significant.<br />
Successful H. pylori eradication improves body growth<br />
<strong>of</strong> children within one year<br />
There were 34 children with successful H. pylori eradica-<br />
2677 June 7, 2012|Volume 18|Issue 21|


