

Evidence base and patients' perspective - World Journal of ...
Evidence base and patients' perspective - World Journal of ...
Evidence base and patients' perspective - World Journal of ...

Create successful ePaper yourself
Turn your PDF publications into a flip-book with our unique Google optimized e-Paper software.
A<br />
A 490<br />
Li YH et al . GABRQ in HCC<br />
1<br />
0.8<br />
0.6<br />
0.4<br />
0.2<br />
0<br />
Control<br />
1 μmol/L<br />
10 μmol/L<br />
20 μmol/L<br />
40 μmol/L<br />
60 μmol/L<br />
t /d 1 2 3 4 5 6<br />
C 2<br />
D<br />
Weight o� tumors<br />
1.6<br />
1.2<br />
0.8<br />
0.4<br />
0<br />
HepG2 HepG2 + GABA<br />
Table 3 Cell cycle <strong>of</strong> HepG-2/Si-Mock <strong>and</strong> HepG-2/Si-1<br />
treated with or without gamma-aminobutyric acid at concentration<br />
<strong>of</strong> 40 μmol/L (mean ± SD, n = 3)<br />
Si-Mock Si-Mock + GABA Si-1 Si-1 + GABA<br />
G0/G1 (%) 49.95 ± 3.16 46.21 ± 2.98 53.95 ± 2.62 48.68 ± 2.49<br />
G2/M (%) 21.61 ± 3.43 20.82 ± 2.43 22.38 ± 2.19 21.45 ± 2.26<br />
S (%) 28.74 ± 3.35 33.64 ± 3.76 a<br />
24.29 ± 2.72 b 27.43 ± 1.95<br />
a P < 0.05, b P < 0.01 vs Si-Mock.<br />
ed HepG2/Si-1 <strong>and</strong> HepG2/Si-Mock cells with or without<br />
GABA (40 μmol/L). The results are shown in Figure<br />
4A: GABA enhanced the growth <strong>of</strong> HepG2/Si-Mock<br />
compared with the HepG2/Si-Mock without GABA.<br />
On the other h<strong>and</strong>, the proliferating ability <strong>of</strong> HepG2/<br />
Si-1, which did not express GABRQ, was not enhanced<br />
by GABA. In the nude mice injected with HepG2/Si-<br />
Mock, the tumor weight <strong>of</strong> the mice treated with GABA<br />
was much larger than that <strong>of</strong> the mice treated without<br />
GABA, while the mice injected with HepG2/Si-1 did not<br />
present such differences (Figure 4C <strong>and</strong> D).<br />
To further explore GABA stimulation <strong>of</strong> HepG2 cell<br />
growth through GABRQ, we examined the effects <strong>of</strong><br />
Si-1 <strong>and</strong> Si-Mock on cell cycle. After treatment with 40<br />
μmol/L GABA, the G0/G1-phase fraction <strong>of</strong> HepG2/<br />
Si-Mock cells significantly decreased; in contrast, S-phase<br />
WJG|www.wjgnet.com<br />
HepG2 + GABA<br />
HepG2<br />
0<br />
0 64 128 192 256 320 384 448 512<br />
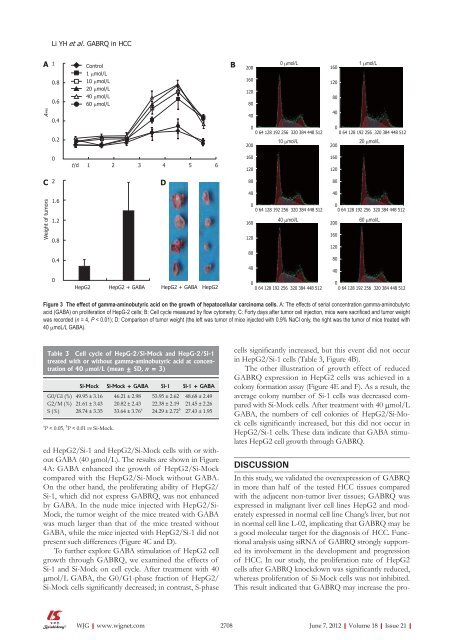
Figure 3 The effect <strong>of</strong> gamma-aminobutyric acid on the growth <strong>of</strong> hepatocellular carcinoma cells. A: The effects <strong>of</strong> serial concentration gamma-aminobutyric<br />
acid (GABA) on proliferation <strong>of</strong> HepG-2 cells; B: Cell cycle measured by flow cytometry; C: Forty days after tumor cell injection, mice were sacrificed <strong>and</strong> tumor weight<br />
was recorded (n = 4, P < 0.01); D: Comparison <strong>of</strong> tumor weight (the left was tumor <strong>of</strong> mice injected with 0.9% NaCl only, the right was the tumor <strong>of</strong> mice treated with<br />
40 μmoL/L GABA).<br />
B<br />
200<br />
160<br />
120<br />
80<br />
40<br />
200<br />
160<br />
120<br />
80<br />
40<br />
cells significantly increased, but this event did not occur<br />
in HepG2/Si-1 cells (Table 3, Figure 4B).<br />
The other illustration <strong>of</strong> growth effect <strong>of</strong> reduced<br />
GABRQ expression in HepG2 cells was achieved in a<br />
colony formation assay (Figure 4E <strong>and</strong> F). As a result, the<br />
average colony number <strong>of</strong> Si-1 cells was decreased compared<br />
with Si-Mock cells. After treatment with 40 μmol/L<br />
GABA, the numbers <strong>of</strong> cell colonies <strong>of</strong> HepG2/Si-Mock<br />
cells significantly increased, but this did not occur in<br />
HepG2/Si-1 cells. These data indicate that GABA stimulates<br />
HepG2 cell growth through GABRQ.<br />
DISCUSSION<br />
0 μmol/L 1 μmol/L<br />
160<br />
0<br />
0 64 128 192 256 320 384 448 512<br />
160<br />
120<br />
80<br />
40<br />
0<br />
0 64 128 192 256 320 384 448 512<br />
40 μmol/L 60 μmol/L<br />
200<br />
In this study, we validated the overexpression <strong>of</strong> GABRQ<br />
in more than half <strong>of</strong> the tested HCC tissues compared<br />
with the adjacent non-tumor liver tissues; GABRQ was<br />
expressed in malignant liver cell lines HepG2 <strong>and</strong> moderately<br />
expressed in normal cell line Chang’s liver, but not<br />
in normal cell line L-02, implicating that GABRQ may be<br />
a good molecular target for the diagnosis <strong>of</strong> HCC. Functional<br />
analysis using siRNA <strong>of</strong> GABRQ strongly supported<br />
its involvement in the development <strong>and</strong> progression<br />
<strong>of</strong> HCC. In our study, the proliferation rate <strong>of</strong> HepG2<br />
cells after GABRQ knockdown was significantly reduced,<br />
whereas proliferation <strong>of</strong> Si-Mock cells was not inhibited.<br />
This result indicated that GABRQ may increase the pro-<br />
2708 June 7, 2012|Volume 18|Issue 21|<br />
120<br />
10 μmol/L 20 μmol/L<br />
200<br />
0<br />
0 64 128 192 256 320 384 448 512<br />
80<br />
40<br />
160<br />
120<br />
80<br />
40<br />
0<br />
0 64 128 192 256 320 384 448 512<br />
160<br />
120<br />
80<br />
40<br />
0<br />
0 64 128 192 256 320 384 448 512


