

Evidence base and patients' perspective - World Journal of ...
Evidence base and patients' perspective - World Journal of ...
Evidence base and patients' perspective - World Journal of ...

Create successful ePaper yourself
Turn your PDF publications into a flip-book with our unique Google optimized e-Paper software.
A<br />
B<br />
C<br />
Study PTEN-positive<br />
n /N<br />
WJG|www.wjgnet.com<br />
PTEN-negtive<br />
n /N<br />
RR (fixed) Weight<br />
%<br />
RR (fixed)<br />
95% CI<br />
01 Primary colorectal cancer<br />
Fotios Loupakis, 2009 11/49 4/36 72.29 2.020 (0.700, 5.834)<br />
FV Negri, 2009 21/38 1/5 27.71 2.763 (0.468, 16.324)<br />
Subtotal (95% CI)<br />
Test for heterogeneity: χ<br />
87 41 100 2.226 (0.893, 5.548)<br />
2 = 0.09, d.f. = 1 (P = 0.765), I 2 = 0.00%<br />
Test for overall effect: Z = 1.72 (P = 0.086)<br />
02 Metastatic tastatic colorectal cancer<br />
Fotios Loupakis, 2009 12/33 1/22 15.56 8.000 (1.119, 57.215)<br />
FV Negri, 2009 14/20 0/4 10.47 6.905 (0.490, 97.254)<br />
Andrea Sartore-Bianchi, 2009 17/49 1/32 15.69 11.102 (1.553, 79.369)<br />
Evangelia Razis, 2008 18/43 3/23 50.69 3.209 (1.055,9.762)<br />
M Frattini, 2007 10/16 0/11 7.6 14.824 (0.958, 229.366)<br />
Subtotal (95% CI)<br />
Test for heterogeneity: χ<br />
161 92 100 6.462 (2.943, 14.192)<br />
2 = 2.21, d.f. = 4 (P = 0.697), I 2 = 0.00%<br />
Test for overall effect: Z = 4.65 (P = 0.000)<br />
Fotios Loupakis, 2009 23/82 5/58 44.06 3.254 (1.314, 8.057)<br />
FV Negri, 2009 35/58 1/9 13.02 5.431 (0.846, 34.874)<br />
Andrea Sartore-Bianchi, 2009 17/49 1/32 9.1 11.102 (1.553, 79.369)<br />
Evangelia Razis, 2008 18/43 3/23 29.41 3.209 (1.055, 9.762)<br />
M Frattini, 2007 10/16 0/11 4.41 14.824 (0.958, 229.366)<br />
Subtotal (95% CI)<br />
Test for heterogeneity: χ<br />
248 133 100 4.749 (2.586, 8.719)<br />
2 = 2.54, d.f. = 4 (P = 0.637), I 2 = 0.00%<br />
Test for overall effect: Z = 5.02 (P = 0.000)<br />
0.001 0.01 0.1 1 10 100 1000<br />
Legend: n = Number <strong>of</strong> responses Favours PTEN-negtive Favour PTEN-positive<br />
N = Number <strong>of</strong> patients<br />
Study HR (fixed)<br />
95% CI<br />
Study HR<br />
95% CI<br />
Weight<br />
%<br />
HR<br />
95% CI<br />
01 PFS fixed-model<br />
Fotios Loupakis, 2009 23.05 0.450 (0.120, 0.870)<br />
Andrea Sartore-Bianchi, 2009 76.95 0.810 (0.470, 1.390)<br />
Subtotal (95% CI) 100.00 0.707 (0.440, 1.138)<br />
Test for heterogeneity: χ 2 = 1.04, d.f. = 1 (P = 0.308), I 2 = 3.9%<br />
Test for overall effect: Z = 1.43 (P = 0.154)<br />
02 OS r<strong>and</strong>om-model<br />
Fotios Loupakis, 2009 28.41 0.500 (0.150, 1.260)<br />
Andrea Sartore-Bianchi, 2009 34.87 0.430 (0.220, 0.810)<br />
Pierre Laurent-Puig, 2009 36.71 1.800 (1.100, 3.100)<br />
Subtotal (95% CI) 100.00 0.759 (0.268, 2.153)<br />
Test for heterogeneity: χ 2 = 12.93, d.f. = 1 (P = 0.002), I 2 = 84.5%<br />
Test for overall effect: Z = 0.52 (P = 0.604)<br />
0.01 0.02 0.05 1 2 5 10<br />
Legend: PFS = Progression-free survival An HR less than 1 indicates a survival advantage<br />
OS = Overall survival<br />
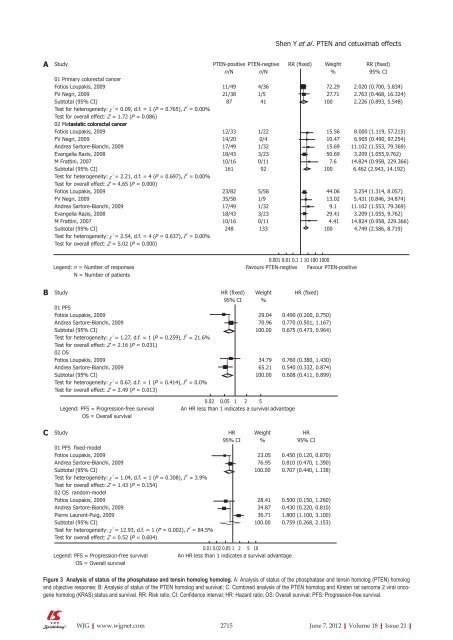
Figure 3 Analysis <strong>of</strong> status <strong>of</strong> the phosphatase <strong>and</strong> tensin homolog homolog. A: Analysis <strong>of</strong> status <strong>of</strong> the phosphatase <strong>and</strong> tensin homolog (PTEN) homolog<br />
<strong>and</strong> objective response; B: Analysis <strong>of</strong> status <strong>of</strong> the PTEN homolog <strong>and</strong> survival; C: Combined analysis <strong>of</strong> the PTEN homolog <strong>and</strong> Kirsten rat sarcoma 2 viral oncogene<br />
homolog (KRAS) status <strong>and</strong> survival. RR: Risk ratio; CI: Confidence interval; HR: Hazard ratio; OS: Overall survival; PFS: Progression-free survival.<br />
Weight<br />
%<br />
HR (fixed)<br />
01 PFS<br />
Fotios Loupakis, 2009 29.04 0.490 (0.200, 0.750)<br />
Andrea Sartore-Bianchi, 2009 70.96 0.770 (0.501, 1.167)<br />
Subtotal (95% CI) 100.00 0.675 (0.473, 0.964)<br />
Test for heterogeneity: χ 2 = 1.27, d.f. = 1 (P = 0.259), I 2 = 21.6%<br />
Test for overall effect: Z = 2.16 (P = 0.031)<br />
02 OS<br />
Fotios Loupakis, 2009 34.79 0.760 (0.380, 1.430)<br />
Andrea Sartore-Bianchi, 2009 65.21 0.540 (0.332, 0.874)<br />
Subtotal (95% CI) 100.00 0.608 (0.411, 0.899)<br />
Test for heterogeneity: χ 2 = 0.67, d.f. = 1 (P = 0.414), I 2 = 0.0%<br />
Test for overall effect: Z = 2.49 (P = 0.013)<br />
0.02 0.05 1 2 5<br />
Legend: PFS = Progression-free survival An HR less than 1 indicates a survival advantage<br />
OS = Overall survival<br />
Shen Y et al . PTEN <strong>and</strong> cetuximab effects<br />
2715 June 7, 2012|Volume 18|Issue 21|


