Asian Sky Quarterly 2022 Q1

You also want an ePaper? Increase the reach of your titles
YUMPU automatically turns print PDFs into web optimized ePapers that Google loves.
1ST QUARTER <strong>2022</strong><br />
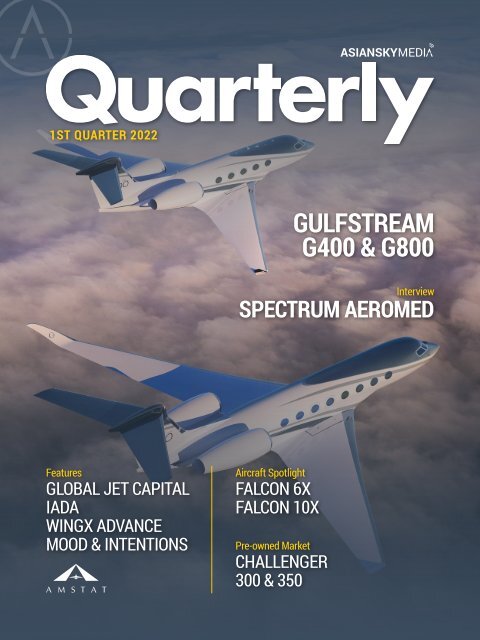
GULFSTREAM<br />
G400 & G800<br />
Interview<br />
SPECTRUM AEROMED<br />
Features<br />
GLOBAL JET CAPITAL<br />
IADA<br />
WINGX ADVANCE<br />
MOOD & INTENTIONS<br />
Aircraft Spotlight<br />
FALCON 6X<br />
FALCON 10X<br />
Pre-owned Market<br />
CHALLENGER<br />
300 & 350<br />
FIRST QUARTER <strong>2022</strong> — ASIAN SKY QUARTERLY | I
GO<br />
BEYOND<br />
Meet our all-new long-distance leader. Reaching 8,000 nm/14,816 km 1<br />
at Mach 0.85, the Gulfstream G800 takes you farther faster, guided<br />
by the award-winning Symmetry Flight Deck.<br />
1<br />
NBAA IFR theoretical range at Mach 0.85 with 8 passengers, 4 crew and NBAA IFR reserves. Actual range will be affected by ATC routing,<br />
operating speed, weather, outfitting options and other factors. All performance is based on preliminary data and subject to change.
CONTENTS<br />
05<br />
SPECIAL FEATURE<br />
WINGX ADVANCE<br />
Asia-Pacific Business Jet Flight Activity <strong>2022</strong> <strong>Q1</strong> Review<br />
40<br />
BIG NEW JETS FROM DASSAULT<br />
ON THE HORIZON<br />
DASSAULT AVIATION<br />
12<br />
ASIA-PACIFIC<br />
MACRO ECONOMICS<br />
Overview of Asia-Pacific’s current status, as well as<br />
country specific data that measures GDP growth<br />
regarding business jet and helicopter fleets.<br />
45<br />
Dassault Aviation updates us on two of the most exciting<br />
upcoming business jets; the Falcon 6X and Falcon 10X.<br />
GLOBAL PRE-OWNED<br />
MARKET UPDATE<br />
AMSTAT<br />
18<br />
ASIA-PACIFIC<br />
QUARTERLY SURVEY<br />
Results of our survey regarding the Asia-Pacific<br />
region’s outlook on the COVID-19 pandemic, economic<br />
51<br />
Global Pre-owned Market Update<br />
GLOBAL BUSINESS AVIATION<br />
MARKET UPDATE<br />
GLOBAL JET CAPITAL<br />
status, aircraft utilization purchase intentions, and<br />
Global Business Aviation Market Update<br />
25<br />
32<br />
influencing factors.<br />
IADA MARKET REPORT<br />
The International Aircraft Dealer’s Association presents<br />
its first quarter market report.<br />
SPECTRUM AEROMED’S<br />
AIRCRAFT MEDICAL SOLUTIONS<br />
SPECTRUM AEROMED<br />
Spectrum Aeromedical talks us through its medical<br />
options.<br />
57<br />
63<br />
72<br />
PRE-OWNED MARKET<br />
CHALLENGER 300 / 350<br />
MARKET DYNAMICS<br />
An analysis of APAC inventory levels, market trends<br />
and the changing price signals for the business jet and<br />
helicopter fleets.<br />
MARKET SUMMARY<br />
BUSINESS JETS<br />
36<br />
STRIVING FOR SAFE AND<br />
SUSTAINABLE FLIGHT<br />
OPERATIONS<br />
SINO JET<br />
90<br />
MARKET SUMMARY<br />
HELICOPTERS<br />
Striving for safe and sustainable flight operations.<br />
COVER IMAGE<br />
Gulfstream<br />
G400 & G800<br />
FIRST QUARTER <strong>2022</strong> — ASIAN SKY QUARTERLY | 1
EDITOR’S NOTE<br />
The first quarter of every year<br />
is normally a quiet one. Call it<br />
a festive period hangover, or<br />
a well-deserved rest following<br />
a hectic fourth quarter, but<br />
the start to every year is<br />
normally quiet.<br />
However, the first quarter of<br />
<strong>2022</strong> was a little different.<br />
First, we had the resurgence of COVID-19 in Greater China, and<br />
then conflict broke out in Ukraine.<br />
Hong Kong was the first part of Greater China to be struck with<br />
a COVID-19 wave. Having avoided any major breakouts until<br />
the first quarter, Hong Kong at one point had 55,000 cases on a<br />
single day. Whilst that might not sound so many compared to<br />
other countries, based on its population size it was the equivalent<br />
of around 500,000 cases in the UK.<br />
Whilst this, and a later breakout in Shanghai caused regional<br />
optimism to slide, the outbreak of conflict in Ukraine caused<br />
optimism to drop. This is in part due to tensions generally<br />
increasing in Western Europe, but also due to trading sanctions<br />
imposed on Russia by other countries.<br />
These trading sanctions included Russian oil exports.<br />
The International Energy Agency (IEA) says that Russia is the<br />
biggest exporter of oil to global markets and that during January<br />
<strong>2022</strong>, before the conflict in Ukraine began, it produced 11 million<br />
barrels per day. The IEA also says that in 2021, 1.3 million barrels<br />
a day were exported to China. It is important to remember that it<br />
was not just crude oil that Russia exported, but also refined oil<br />
and liquid natural gas.<br />
The suspension of trading with Russia caused oil prices to<br />
increase in many markets, which in turn pushed up inflation.<br />
Inflation is used as an indicator to show how much the price of<br />
goods and services has increased. Although this had been rising<br />
on a global scale, the conflict in Ukraine has seen it accelerate.<br />
Another factor that could have an impact on the industry further<br />
down the line, and is no doubt denting optimism, is an increase in<br />
insurance premiums for aircraft. Much of the Russian commercial<br />
aircraft fleet has been leased from non-Russian lessors, and<br />
unfortunately, many of those aircraft are expected to never leave<br />
Russia again. With no other choice, many lessors have started to<br />
file insurance claims to try and claw back some of the value of<br />
their lost assets. This includes Aercap, one of the world’s biggest<br />
lessors, which filed a US$3 billion claim covering 100 aircraft.<br />
If those claims are successful, then insurers themselves will need<br />
to recover their own losses. The only way they can begin to do<br />
this is by raising insurance premiums for other aircraft.<br />
But it’s not all doom and gloom this quarter, there have been<br />
some positive signs as well. This has been very noticeable in<br />
the pre-owned market, which continues to see strong activity.<br />
The International Aircraft Dealers Association, whose accredited<br />
members buy and sell more aircraft by dollar value than the rest<br />
of the world’s dealers combined, presents its First Quarter Market<br />
SPECIAL THANKS TO OUR CONTRIBUTORS<br />
2 | ASIAN SKY QUARTERLY — FIRST QUARTER <strong>2022</strong>
PUBLISHER<br />
Report, which outlines all of the deals and activity that its<br />
members have seen.<br />
Elsewhere in this issue of <strong>Asian</strong> <strong>Sky</strong> <strong>Quarterly</strong>, there is<br />
all of the usual hard data and intel that you have come<br />
to rely on. We also have interviews with Asia-Pacific’s<br />
biggest operator Sino Jet and medical equipment supplier<br />
Spectrum Aeromed.<br />
We round off the issue with a global business aviation<br />
market update by Global Jet Capital, an update on flight<br />
activity with data kindly supplied by WINGX, and a special<br />
feature by Dassault Aviation about its upcoming Falcon 10X<br />
and Falcon 6X, the latter of which is due to enter service<br />
before the end of the year.<br />
EDITORIAL & MARKET RESEARCH<br />
Alud Davies<br />
Bowen Zhang<br />
Tiffany Tong<br />
Liana Liu<br />
Icy Ho<br />
DESIGN<br />
Amy Liu<br />
Luna Huang<br />
ADVERTISING/ENQUIRIES:<br />
jwong@asianskygroup.com<br />
(852) 9199 7751<br />
www.asianskymedia.com<br />
Sincerely,<br />
Alud Davies<br />
Media & Communications Director<br />
<strong>Asian</strong> <strong>Sky</strong> Media<br />
<strong>Asian</strong> <strong>Sky</strong> Media is part of the <strong>Asian</strong> <strong>Sky</strong> Group. The materials and<br />
information provided by <strong>Asian</strong> <strong>Sky</strong> Media (“ASM”) in this report is for<br />
reference only. While such information was compiled using the best<br />
available data as of March 1, <strong>2022</strong>, any information we provide about<br />
how we may interpret the data and market, or how certain issues<br />
may be addressed is provided generally without considering your<br />
specific circumstances. Such information should not be regarded<br />
as a substitute for professional advice. Independent professional<br />
advice should be sought before taking action on any matters to which<br />
information provided in this report may be relevant.<br />
ASM shall not be liable for any losses, damage, costs or expenses<br />
howsoever caused, arising directly or indirectly from the use of or<br />
inability to use this report or use of or reliance upon any information<br />
or material provided in this report or otherwise in connection with any<br />
representation, statement or information on or contained in this report.<br />
ASM endeavors to ensure that the information contained in this report<br />
is accurate as at the date of publication, but does not guarantee<br />
or warrant its accuracy or completeness, or accept any liability of<br />
whatever nature for any losses, damage, costs or expenses howsoever<br />
caused, whether arising directly or indirectly from any error or<br />
omission in compiling such information. This report also uses third<br />
party information not compiled by ASM. ASM is not responsible for<br />
such information and makes no representation about the accuracy,<br />
completeness or any other aspect of information contained. The<br />
information, data, articles, or resources provided by any other parties<br />
do not in any way signify that ASM endorses the same.<br />
FIRST QUARTER <strong>2022</strong> — ASIAN SKY QUARTERLY | 3
STEP INTO THE<br />
TALLEST AND<br />
WIDEST CABIN IN<br />
THE INDUSTRY.<br />
The incomparable Falcon 6X cabin. 1.98 m tall, 2.58 m wide. With wide aisles. Bright, extra-large windows<br />
and skylight. Whisper-quiet cabin. Cutting-edge technology. Amazing.<br />
WWW.FALCON6X.COM I BEIJING: +86 10 5696 5200 I SHANGHAI: +86 21 5116 6845 I KUALA LUMPUR: +603 2031 8252
ASIA-PACIFIC<br />
BUSINESS JET<br />
FLIGHT ACTIVITY<br />
<strong>2022</strong> <strong>Q1</strong> REVIEW<br />
Analysis By Liana Liu<br />
WINGX is a data research and consulting company, which provides actionable<br />
market intelligence to the global business aviation industry. Our interactive webhosted<br />
dashboards provide our customers with the data-visualization they need to<br />
stay alert to market trends, keep tabs on market share, identify competitive threats<br />
and spot new sales opportunities. WINGX customers include aircraft operators,<br />
airframe, engine and avionics OEMs, airlines, maintenance providers, airports,<br />
fixed-based operators, satcom providers, fuel providers, legal advisors, leasing<br />
companies, banks, regulators, investors and private jet users.<br />
For further information and a free demo of our dashboards, please contact:<br />
Richard or Christoph at office@wingx-advance.com<br />
WINGX Data Source: ADSB and ATC<br />
DATA BY<br />
FIRST QUARTER <strong>2022</strong> — ASIAN SKY QUARTERLY | 5
SPECIAL FEATURE: FLIGHT ACTIVITY<br />
NUMBER OF DEPARTURES<br />
Number of Departures<br />
YoY Trend<br />
4,865<br />
244.1%<br />
4,732<br />
4,235<br />
4,309<br />
4,447<br />
4,126<br />
4,288<br />
4,852<br />
4,569<br />
5,260<br />
4,408<br />
4,740<br />
5,478<br />
114.9%<br />
55.9%<br />
48.9%<br />
38.2%<br />
13.7%<br />
15.4%<br />
20.6%<br />
7.5%<br />
11.6%<br />
0.2%<br />
13.5% 12.6%<br />
Mar<br />
21<br />
Apr<br />
21<br />
May<br />
21<br />
Jun<br />
21<br />
Jul<br />
21<br />
Aug<br />
21<br />
Sep<br />
21<br />
Oct<br />
21<br />
Nov<br />
21<br />
Dec<br />
21<br />
Jan<br />
22<br />
Feb<br />
22<br />
Mar<br />
22<br />
During the first month of <strong>2022</strong>, business jet flight activity in the<br />
Asia-Pacific region still faced challenges brought on by COVID-19.<br />
Days after identifying the highly transmissible Omicron variant in<br />
South Africa, many countries postponed their plans to open their<br />
borders. Business jet flight activity in January <strong>2022</strong> decreased<br />
by 16.2% from the previous month. In addition to pandemicrelated<br />
restrictions, fewer global events scheduled in January<br />
also contributed to the decline in activity. As the World Health<br />
Organization acquired more information about the new variant,<br />
countries enhanced their current vaccination programs. Based on<br />
the data provided by the health department of each government,<br />
countries like India only had around 30% of its citizens completely<br />
vaccinated before the occurrence of Omicron but had reached<br />
a 60% full-vaccination rate by the end of March <strong>2022</strong>. Many<br />
Asia-Pacific countries were more willing to reopen their borders<br />
as more people completed the vaccination process and thus<br />
business jet departures increased by 15.6% to 5,478 flights in<br />
March. Although the average monthly flights in the first quarter of<br />
<strong>2022</strong> were lower than the previous quarter, flights in March <strong>2022</strong><br />
outperformed all other months.<br />
However, flight activity has been overall increasing, and reached<br />
a peak of 248 flights on March 25. Flight activity in late March<br />
outperformed pre-pandemic levels as people hoped to stimulate<br />
economies by increasing business activities and leisure travel<br />
began to return. The lowest trough occurred on December 31,<br />
2021, similar to the situation seen in 2020, which may be related<br />
to the new year celebrations.<br />
DEPARTURES BY DATE<br />
300<br />
March 2019-March 2020 March 2020-March 2021 March 2021-March <strong>2022</strong><br />
250<br />
200<br />
150<br />
100<br />
50<br />
0<br />
Mar Apr May Jun Jul Aug Sep Oct Nov Dec<br />
Jan<br />
Feb<br />
Mar<br />
6 | ASIAN SKY QUARTERLY — FIRST QUARTER <strong>2022</strong>
SPECIAL FEATURE: FLIGHT ACTIVITY<br />
FLIGHT ACTIVITIES<br />
4,000<br />
3,500<br />
3,000<br />
2,500<br />
Thailand<br />
Singapore<br />
Malaysia<br />
2,000<br />
1,500<br />
India<br />
1,000<br />
500<br />
Japan<br />
Greater China<br />
0<br />
Mar<br />
21<br />
Apr<br />
21<br />
May<br />
21<br />
Jun<br />
21<br />
Jul<br />
21<br />
Aug<br />
21<br />
Sep<br />
21<br />
Oct<br />
21<br />
Nov<br />
21<br />
Dec<br />
21<br />
Jan<br />
22<br />
Feb<br />
22<br />
Mar<br />
22<br />
Greater China and India saw the most departures; however, the yearon-year<br />
growth has been negative for Greater China and is declining in<br />
India. Mainland China’s zero-COVID policy imposed strict quarantine<br />
procedures and paused the issuance of ordinary passports for nonessential<br />
travelling, which caused the negative year-on-year seen in<br />
Greater China. India’s flight activity in the first quarter of 2021 grew<br />
significantly due to outbound flights for healthcare resources; hence,<br />
compared to 2021, flight activity in the first quarter of <strong>2022</strong> were<br />
less active. Malaysia, Singapore and Thailand all have positive year-<br />
over-year growth in the first quarter of <strong>2022</strong>, as their airports were<br />
open with some restrictions. Overall, these countries are engaging in<br />
similar tourism activities as they were before the pandemic. With the<br />
vaccination rate increasing, governments are more willing to loosen<br />
COVID-19 related restrictions and therefore saw a rebound in their local<br />
economies. Japan experienced less significant year-over-year growth in<br />
January and February. Later, it allowed entry to non Japanese citizens<br />
except for tourism purposes starting on March 1st, <strong>2022</strong>. The measure<br />
stimulated flight activity and fostered business recovery in Japan.<br />
FLIGHT ACTIVITY TREND<br />
400%<br />
2021 Mar - <strong>2022</strong> Mar<br />
1,475%<br />
350%<br />
300%<br />
278%<br />
250%<br />
200%<br />
203%<br />
221%<br />
150%<br />
136%<br />
100%<br />
50%<br />
67%<br />
0%<br />
-50%<br />
Greater China Japan India Malaysia Singapore Thailand<br />
FIRST QUARTER <strong>2022</strong> — ASIAN SKY QUARTERLY | 7
SPECIAL FEATURE: FLIGHT ACTIVITY<br />
FLIGHT DURATIONS<br />
6,000<br />
5,000<br />
More than five hours<br />
Four to five hours<br />
Three to four hours<br />
4,000<br />
Two to three hours<br />
3,000<br />
One to two hours<br />
2,000<br />
1,000<br />
30 min. to one hour<br />
0<br />
Max 30 min.<br />
Mar<br />
21<br />
Apr<br />
21<br />
May<br />
21<br />
Jun<br />
21<br />
Jul<br />
21<br />
Aug<br />
21<br />
Sep<br />
21<br />
Oct<br />
21<br />
Nov<br />
21<br />
Dec<br />
21<br />
Jan<br />
22<br />
Feb<br />
22<br />
Mar<br />
22<br />
Flight durations between 30<br />
minutes to two hours remained<br />
the most popular in the Asia-<br />
Pacific region. The periodto-date<br />
growth for flights<br />
that had a duration of more<br />
than five hours in the first<br />
quarter of <strong>2022</strong> was 24.5%. In<br />
addition to total flight activity<br />
increasing, the proportion<br />
of international business jet<br />
trips also expanded. It showed<br />
that consumers were more<br />
confident in flying to other<br />
countries, while still having<br />
some concerns regarding<br />
safety. Thus, people that<br />
can afford business jet trips<br />
would choose to do so. With<br />
trips ranging from one to<br />
two hours having the largest<br />
share and international flights<br />
increasing, it suggests that<br />
people are most likely to travel<br />
to nearby countries.<br />
DOMESTIC VS. INTERNATIONAL FLIGHTS<br />
<strong>2022</strong> <strong>Q1</strong><br />
2021 <strong>Q1</strong><br />
Domestic Flights International Flights<br />
57%, 40819 75%, 10,08743%, 31405<br />
25%, 3,354<br />
54%, 53028 71%, 10,337<br />
46%, 45725<br />
29%, 4,289<br />
0 2,000<br />
4,000<br />
6,000<br />
8,000<br />
10,000 12,000 14,000 16,000<br />
Country/Subregion Number of Departures <strong>2022</strong> <strong>Q1</strong> YoY Trend<br />
India 3,173 4%<br />
Greater China 2,451 -31%<br />
Japan 1,062 19%<br />
Thailand 1,049 66%<br />
Malaysia 814 41%<br />
Singapore 533 78%<br />
8 | ASIAN SKY QUARTERLY — FIRST QUARTER <strong>2022</strong>
SPECIAL FEATURE: FLIGHT ACTIVITY<br />
FLIGHT DURATIONS IN GREATER CHINA<br />
Although Greater China saw a sharp<br />
1,600<br />
decline in activity from November 2021,<br />
Hong Kong, Taiwan and Macao were<br />
1,400<br />
all steady during the first quarter of<br />
1,200<br />
<strong>2022</strong>. Pandemic-related policies caused<br />
a continuous decrease in activities in<br />
1,000<br />
mainland China. Once these restrictions<br />
800<br />
600<br />
400<br />
More than five hours<br />
Four to five hours<br />
Three to four hours<br />
Two to three hours<br />
are removed, it is likely that the market<br />
will become positive again.<br />
According to the Embassy of India,<br />
the Indian population accounts for<br />
200<br />
0<br />
Mar<br />
21<br />
Apr<br />
21<br />
May<br />
21<br />
Jun<br />
21<br />
Jul<br />
21<br />
Aug<br />
21<br />
Sep<br />
21<br />
Oct<br />
21<br />
Nov<br />
21<br />
Dec<br />
21<br />
Jan<br />
22<br />
Feb<br />
22<br />
Mar<br />
22<br />
One to two hours<br />
30 min. to one hours<br />
Max 30 min.<br />
30% of the United Arab Emirates (UAE)<br />
total population, and 15% of Indian<br />
immigrants are professionals and<br />
businesspeople. Hence, jet connections<br />
GREATER CHINA DEPARTURES<br />
Mainland China Hong Kong<br />
Taiwan Macao<br />
between these two countries are<br />
mainly for business and family visits.<br />
In February <strong>2022</strong>, India signed a<br />
Comprehensive Economic Partnership<br />
1,600<br />
Agreement with the UAE to enhance<br />
1,400<br />
1,200<br />
non-oil trade between the two countries<br />
with hopes to open more opportunities<br />
for investment and trading. The<br />
1,000<br />
agreement further enhances the<br />
800<br />
600<br />
business jet activities between India<br />
and the UAE.<br />
400<br />
After two and a half years of<br />
200<br />
0<br />
Mar<br />
21<br />
Apr<br />
21<br />
May<br />
21<br />
Jun<br />
21<br />
Jul<br />
21<br />
Aug<br />
21<br />
Sep<br />
21<br />
Oct<br />
21<br />
Nov<br />
21<br />
Dec<br />
21<br />
Jan<br />
22<br />
Feb<br />
22<br />
Mar<br />
22<br />
negotiations, Indonesia and Singapore<br />
signed three agreements to resolve the<br />
longstanding issues regarding airspace<br />
management, defense cooperation<br />
BUSIEST INTERNATIONAL ROUTE <strong>2022</strong> <strong>Q1</strong><br />
and extradition on January 25th, <strong>2022</strong>.<br />
This further increased business jet<br />
India - United Arab Emirates<br />
1,034<br />
activity between these two countries.<br />
The number of flights departing from<br />
Singapore - Indonesia<br />
528<br />
Singapore and arriving in Indonesia<br />
Hong Kong - Austria<br />
494<br />
jumped from 59 flights in March 2021<br />
Indonesia - Singapore<br />
455<br />
to 74 in March <strong>2022</strong>.<br />
Maldives - United Arab Emirates<br />
Singapore - Malaysia<br />
Maldives - Russia<br />
246<br />
245<br />
434<br />
Domestic connections dominated<br />
the busiest routes in the Asia-<br />
Pacific region, especially in India.<br />
Malaysia - Singapore<br />
231<br />
It is also worth noting that an<br />
Thailand - Cambodia<br />
Cambodia - Thailand<br />
223<br />
222<br />
eighth of the jet activity in mainland<br />
China are dedicated to training and<br />
maintenance purposes.<br />
FIRST QUARTER <strong>2022</strong> — ASIAN SKY QUARTERLY | 9
SPECIAL FEATURE: FLIGHT ACTIVITY<br />
TOP OEM FLIGHT ACTIVITIES<br />
Flights<br />
PTD Growth<br />
3,315 3,294<br />
1,725.0%<br />
2,617<br />
1,643<br />
1,578<br />
-4.7% 6.0%<br />
24.7%<br />
1.1% 5.1%<br />
1,011<br />
180.2%<br />
19.6% 30.2%<br />
483 339<br />
31.7%<br />
183<br />
73<br />
Bombardier<br />
Gulfstream<br />
Cessna<br />
Embraer<br />
Dassault<br />
Hawker<br />
Learjet<br />
Honda<br />
Airbus<br />
Pilatus<br />
Bombardier remained the most popular Original Equipment<br />
Manufacturer (OEM) in the Asia-Pacific region. Its Global<br />
series models are widely used since they are in the Long Range<br />
category that can support international travel. Gulfstream,<br />
another OEM known for its Long Range models, ranked second<br />
with 21 fewer flights. Together, models manufactured by these<br />
two OEMs accounted for 45% of the business jet activity in the<br />
Asia-Pacific region in the first quarter of <strong>2022</strong>. Pilatus’ aircraft<br />
only accounted for four flights in the first quarter of 2021. As<br />
people engage in domestic travel, the demand for Very Light Jets<br />
has increased.<br />
TOP CITY FLIGHT ACTIVITY TRENDS<br />
Jet activity in New Delhi, Bangkok, Singapore and Manila has<br />
seen a steady increase since January <strong>2022</strong>. Airports in these<br />
cities now allow non Citizens to enter the country without strict<br />
quarantine if they are fully vaccinated. Governments are now<br />
taking steps to rebound their economies. India saw the greatest<br />
number of flights in the first quarter of <strong>2022</strong>, with a large portion<br />
being domestic hops. The overall business jet market showed a<br />
positive sign of recovery.<br />
Number of Departures YoY %<br />
Bangkok<br />
Beijing<br />
148%<br />
137%<br />
304%<br />
100%<br />
88%<br />
10%<br />
109<br />
109<br />
73%<br />
76<br />
109<br />
49%<br />
100<br />
43%<br />
103<br />
15%<br />
100<br />
35%<br />
123<br />
160<br />
33%<br />
173<br />
33%<br />
134<br />
26%<br />
151<br />
205<br />
106%<br />
175<br />
226<br />
141%<br />
193<br />
76%<br />
162<br />
85%<br />
194<br />
-10%<br />
147<br />
12%<br />
203<br />
15%<br />
205<br />
-53%<br />
88<br />
-32%<br />
135<br />
-18%<br />
134<br />
-34%<br />
111<br />
-61%<br />
69<br />
Mar<br />
21<br />
Apr<br />
21<br />
May<br />
21<br />
Jun<br />
21<br />
Jul<br />
21<br />
Aug<br />
21<br />
Sep<br />
21<br />
Oct<br />
21<br />
Nov<br />
21<br />
Dec<br />
21<br />
Jan<br />
22<br />
Feb<br />
22<br />
Mar<br />
22<br />
Mar<br />
21<br />
Apr<br />
21<br />
May<br />
21<br />
Jun<br />
21<br />
Jul<br />
21<br />
Aug<br />
21<br />
Sep<br />
21<br />
Oct<br />
21<br />
Nov<br />
21<br />
Dec<br />
21<br />
Jan<br />
22<br />
Feb<br />
22<br />
Mar<br />
22<br />
10 | ASIAN SKY QUARTERLY — FIRST QUARTER <strong>2022</strong>
FIRST QUARTER <strong>2022</strong> — ASIAN SKY QUARTERLY | 11<br />
Hong Kong<br />
Mar<br />
21<br />
Aug<br />
21<br />
Dec<br />
21<br />
Jun<br />
21<br />
Oct<br />
21<br />
Feb<br />
22<br />
Apr<br />
21<br />
May<br />
21<br />
Sep<br />
21<br />
Jan<br />
22<br />
Jul<br />
21<br />
Nov<br />
21<br />
Mar<br />
22<br />
124<br />
113<br />
94<br />
105<br />
105<br />
107<br />
114<br />
106<br />
113<br />
109<br />
109<br />
109<br />
97<br />
-54%<br />
-9%<br />
-15%<br />
-15%<br />
-43%<br />
-30%<br />
6%<br />
-31%<br />
-39%<br />
-30%<br />
-41%<br />
-21%<br />
-14%<br />
Manila<br />
Tokyo<br />
Jakarta<br />
Mar<br />
21<br />
Mar<br />
21<br />
Aug<br />
21<br />
Aug<br />
21<br />
Dec<br />
21<br />
Sep<br />
21<br />
Jun<br />
21<br />
Jun<br />
21<br />
Oct<br />
21<br />
Oct<br />
21<br />
Feb<br />
22<br />
Feb<br />
22<br />
Apr<br />
21<br />
Apr<br />
21<br />
May<br />
21<br />
May<br />
21<br />
Sep<br />
21<br />
Sep<br />
21<br />
Jan<br />
22<br />
Jan<br />
22<br />
Jul<br />
21<br />
Jul<br />
21<br />
Nov<br />
21<br />
Nov<br />
21<br />
Mar<br />
22<br />
Mar<br />
22<br />
150<br />
63<br />
261<br />
117<br />
151<br />
83<br />
193<br />
86<br />
253<br />
94<br />
178<br />
69<br />
173<br />
108<br />
149<br />
87<br />
141<br />
94<br />
157<br />
90<br />
207<br />
93<br />
183<br />
76<br />
157<br />
90<br />
83%<br />
-31%<br />
74%<br />
86%<br />
70%<br />
34%<br />
65%<br />
21%<br />
56%<br />
47%<br />
15%<br />
6%<br />
15%<br />
38%<br />
39%<br />
58%<br />
18%<br />
81%<br />
35%<br />
48%<br />
180%<br />
19%<br />
210%<br />
49%<br />
New Delhi<br />
Mar<br />
21<br />
Aug<br />
21<br />
Dec<br />
21<br />
Jun<br />
21<br />
Oct<br />
21<br />
Feb<br />
22<br />
Apr<br />
21<br />
May<br />
21<br />
Sep<br />
21<br />
Jan<br />
22<br />
Jul<br />
21<br />
Nov<br />
21<br />
Mar<br />
22<br />
255 270<br />
230<br />
161<br />
263<br />
258<br />
238<br />
171<br />
211<br />
219<br />
181<br />
214<br />
218<br />
120%<br />
6%<br />
18%<br />
-8%<br />
42%<br />
42%<br />
51%<br />
19%<br />
67%<br />
99%<br />
66%<br />
422%<br />
2,625%<br />
349%<br />
96%<br />
Singapore<br />
Mar<br />
21<br />
Aug<br />
21<br />
Dec<br />
21<br />
Jun<br />
21<br />
Oct<br />
21<br />
Feb<br />
22<br />
Apr<br />
21<br />
May<br />
21<br />
Sep<br />
21<br />
Jan<br />
22<br />
Jul<br />
21<br />
Nov<br />
21<br />
Mar<br />
22<br />
244<br />
427<br />
315<br />
281<br />
316<br />
312<br />
213<br />
213<br />
201<br />
211<br />
223<br />
168<br />
234<br />
2%<br />
75%<br />
54%<br />
52%<br />
25%<br />
60%<br />
11%<br />
-7%<br />
-5%<br />
29%<br />
48%<br />
33%<br />
182%<br />
Mar<br />
21<br />
Aug<br />
21<br />
Dec<br />
21<br />
Jun<br />
21<br />
Oct<br />
21<br />
Feb<br />
22<br />
Apr<br />
21<br />
May<br />
21<br />
Sep<br />
21<br />
Jan<br />
22<br />
Jul<br />
21<br />
Nov<br />
21<br />
Mar<br />
22<br />
66<br />
208<br />
169<br />
104<br />
123<br />
125<br />
111<br />
98<br />
87<br />
118<br />
104<br />
75<br />
72<br />
35%<br />
215%<br />
173%<br />
63%<br />
71%<br />
79%<br />
79%<br />
145%<br />
81%<br />
146%<br />
189%<br />
317%<br />
929%<br />
SPECIAL FEATURE: FLIGHT ACTIVITY
ASIA-PACIFIC<br />
MOOD &<br />
INTENTIONS<br />
MACRO ECONOMICS AND<br />
QUARTERLY SURVEY<br />
<strong>2022</strong> <strong>Q1</strong>
MACRO ECONOMICS<br />
GREATER CHINA<br />
| MAINLAND CHINA, HONG KONG, MACAO & TAIWAN<br />
Mainland China<br />
GDP GROWTH (BILLION USD)<br />
MOOD & INTENTIONS: ECONOMICS<br />
Despite slowing in the fourth quarter, China’s<br />
economy expanded by 8.1% in 2021, largely due to an<br />
expansion of 18.3% in <strong>Q1</strong>. Growth in Q4 slowed due<br />
to a resurgence of COVID-19 in the country, as well as<br />
a slowdown in the real estate sector. China’s growth<br />
target for <strong>2022</strong> is 5.5%, although this was set before<br />
the COVID-19 outbreaks in several key Chinese cities.<br />
Taiwan, China<br />
Taiwan’s 6.2% growth in 2021 was the highest for 11<br />
years and was mainly driven by strong exports. In the<br />
fourth quarter alone, exports grew by 11.92%, driven<br />
by an increase in technology exports. GDP growth is<br />
project to slow to just under 4% in <strong>2022</strong>, as inflation<br />
rises in the region.<br />
$11,233<br />
$321<br />
$45<br />
Mainland China Taiwan Hong Kong<br />
Macao<br />
$12,310<br />
$341<br />
$50<br />
$13,895 $14,280 $14,723<br />
$362<br />
$55<br />
$366<br />
$55<br />
$30<br />
2016 2017 2018 2019 2020<br />
$15,048<br />
$535 $543<br />
$591 $608 $611 $640<br />
$347<br />
$366<br />
$28<br />
YE2021<br />
Hong Kong, China<br />
Hong Kong’s economy grew by 6.4% in 2021, almost<br />
reversing a 6.5% contraction in 2020. This was largely<br />
due to an increase in exports, which had previously<br />
been hampered by COVID-19 related restrictions. Hong<br />
Kong’s economy had been forecast to grow between<br />
2 – 3.5% in <strong>2022</strong>, however a worse than expected first<br />
quarter could see that forecast revised.<br />
Macao, China<br />
Macao’s economy bounced back from a 54%<br />
contraction in 2020 to a 18% increase in 2021, thanks<br />
in no small part to the return of gaming and tourism<br />
services from mainland Chinese visitors.<br />
*Data Source : Trading Economics<br />
*Macao’s PMI is not available.<br />
A reading above 50 indicates an expansion of the manufacturing sector<br />
compared to the previous month; below 50 represents a contraction; while<br />
50 indicates no change.<br />
PURCHASING MANAGER’S INDEX<br />
66.0%<br />
64.0%<br />
62.0%<br />
60.0%<br />
58.0%<br />
56.0%<br />
54.0%<br />
52.0%<br />
50.0%<br />
48.0%<br />
46.0%<br />
44.0%<br />
42.0%<br />
40.0%<br />
38.0%<br />
36.0%<br />
34.0%<br />
32.0%<br />
30.0%<br />
Mainland China Taiwan Hong Kong<br />
Feb 21<br />
Mar 21<br />
Apr 21<br />
May 21<br />
Jun 21<br />
Jul 21<br />
Aug 21<br />
Sep 21<br />
Oct 21<br />
Nov 21<br />
Dec 20<br />
Jan 22<br />
Feb 22<br />
Expansion Contraction<br />
FLEET SIZE GROWTH<br />
Mainland China Taiwan Hong Kong<br />
Macao<br />
Business Jet Turbine Helicopter Turboprop*<br />
344<br />
338<br />
332<br />
342<br />
340<br />
581<br />
679<br />
718 772<br />
766<br />
258<br />
280<br />
282<br />
135<br />
135<br />
122<br />
122<br />
101<br />
25<br />
9<br />
27<br />
10<br />
27<br />
10<br />
2017 2018 2019 2020 2021<br />
29<br />
10<br />
28<br />
10<br />
21<br />
15<br />
25<br />
19<br />
24<br />
23<br />
29<br />
18<br />
26<br />
19<br />
2017 2018 2019 2020 2021<br />
2017 2018 2019 2020 2021<br />
5<br />
4<br />
5<br />
3<br />
4<br />
2<br />
4<br />
1<br />
4<br />
1<br />
Data Source : The business jet and helicopter fleet: <strong>Asian</strong> <strong>Sky</strong> Group’s Business Jet Fleet Report & Helicopter Fleet Report, Turboprop data provided by AMSTAT.<br />
The current fleet data is preliminary, all fleet size data will be finalized in the upcoming Helicopter / Business Jet Fleet Report.<br />
* Historical data under review<br />
FIRST QUARTER <strong>2022</strong> — ASIAN SKY QUARTERLY | 13
MOOD & INTENTIONS: ECONOMICS<br />
AUSTRALASIA<br />
| AUSTRALIA, NEW ZEALAND & PAPUA NEW GUINEA<br />
Australia<br />
Australia’s economy grew by 4.2% in 2021, thanks<br />
to a strong forth quarter. This was driven by growth<br />
in household spending in States that had previously<br />
been locked down due to COVID-19 restrictions. This<br />
included a 14.2% increase in non-essential spending<br />
– the highest growth on record. In <strong>2022</strong> Australia’s<br />
economy is projected to grow by 3.7%.<br />
GDP GROWTH (BILLION USD)<br />
$192<br />
Australia<br />
$208<br />
New Zealand<br />
$209<br />
Papua New Guinea<br />
$1,209 $1,329<br />
$1,433 $1,397 $1,331 $1,401<br />
$209<br />
$212<br />
$222<br />
New Zealand<br />
The economy in New Zealand grew by 5.6% in 2021,<br />
having contracted by 0.3% in 2020. Business and<br />
retail services were behind the increase, particularly<br />
in, accommodation, and restaurants. New Zealand’s<br />
economy is projected to expand by 2.9% in <strong>2022</strong>.<br />
$21<br />
$23<br />
$23 $25<br />
$24<br />
2016 2017 2018 2019 2020<br />
PURCHASING MANAGER’S INDEX<br />
Australia<br />
New Zealand<br />
70.0%<br />
YE2021<br />
*Data Source : Trading Economics<br />
*PNG’s PMI is not available.<br />
A reading above 50 indicates an expansion of the manufacturing sector<br />
compared to the previous month; below 50 represents a contraction; while<br />
50 indicates no change.<br />
65.0%<br />
60.0%<br />
55.0%<br />
50.0%<br />
45.0%<br />
40.0%<br />
35.0%<br />
30.0%<br />
Expansion Contraction<br />
Feb 22<br />
Jan 22<br />
Dec 20<br />
Nov 21<br />
Oct 21<br />
Sep 21<br />
Aug 21<br />
Jul 21<br />
Jun 21<br />
May 21<br />
Apr 21<br />
Mar 21<br />
Feb 21<br />
FLEET SIZE GROWTH<br />
Australia New Zealand Papua New Guinea<br />
Business Jet Turbine Helicopter Turboprop*<br />
186<br />
185<br />
199<br />
211<br />
209<br />
832<br />
853<br />
844<br />
876<br />
908<br />
428<br />
433<br />
432<br />
431<br />
443<br />
16<br />
19<br />
19<br />
22<br />
29<br />
478<br />
511<br />
534 542<br />
564<br />
51<br />
54<br />
56<br />
58<br />
59<br />
4<br />
4<br />
3<br />
3<br />
3<br />
104<br />
116<br />
103 91<br />
89<br />
22<br />
23<br />
28<br />
29<br />
30<br />
2017 2018 2019 2020 2021<br />
2017 2018 2019 2020 2021<br />
2017 2018 2019 2020 2021<br />
Data Source : The business jet and helicopter fleet: <strong>Asian</strong> <strong>Sky</strong> Group’s Business Jet Fleet Report & Helicopter Fleet Report, Turboprop data provided by AMSTAT.<br />
The current fleet data is preliminary, all fleet size data will be finalized in the upcoming Helicopter / Business Jet Fleet Report.<br />
* Historical data under review<br />
14 | ASIAN SKY QUARTERLY — FIRST QUARTER <strong>2022</strong>
& INTENTIONS: ECONOMICS<br />
SOUTHEAST ASIA<br />
| THAILAND, MALAYSIA & SINGAPORE<br />
MOOD<br />
Thailand<br />
The Thai economy expanded by 1.6% in 2021, as global<br />
trade resumed, and exports of Thai goods increased.<br />
Some growth was also seen in the inbound tourism<br />
sector, although this was still well below pre-pandemic<br />
levels. For the <strong>2022</strong> full year, the Thai economy is<br />
expected to grow by around 3.2%.<br />
Malaysia<br />
Malaysia’s economy grew by 3.6%, driven by an<br />
increase in the manufacturing sector, as well as<br />
exports. Unemployment rates, which had reached<br />
record highs, declined to 4.6% in the fourth quarter.<br />
Full year growth in Malaysia is expected to reach 5.5%<br />
in <strong>2022</strong>.<br />
Singapore<br />
Singapore’s economy grew by 7.6% in 2021 following<br />
a contraction of 4.1% in 2020. Manufacturing<br />
contributed with a 13.2% increase in output during<br />
the year accounting for 22.3% of the country’s GDP.<br />
Singapore’s economy is projected to grow by 4.4%.<br />
GDP GROWTH (BILLION USD)<br />
45.0%<br />
40.0%<br />
$373<br />
$342<br />
$319 $359<br />
$301<br />
Thailand<br />
$319<br />
Malaysia<br />
Singapore<br />
$372<br />
$365<br />
PURCHASING MANAGER’S INDEX<br />
60.0%<br />
55.0%<br />
50.0%<br />
$413<br />
Thailand<br />
$456<br />
Malaysia<br />
$507<br />
Singapore<br />
$544<br />
$337<br />
2016 2017 2018 2019 2020<br />
$502 $512<br />
$340<br />
$359<br />
$369<br />
YE2021<br />
Expansion Contraction<br />
*Data Source : Trading Economics<br />
*A reading above 50 indicates an expansion of the manufacturing sector<br />
compared to the previous month; below 50 represents a contraction; while<br />
50 indicates no change.<br />
35.0%<br />
30.0%<br />
Feb 21<br />
Mar 21<br />
Apr 21<br />
May 21<br />
Jun 21<br />
Jul 21<br />
Aug 21<br />
Sep 21<br />
Oct 21<br />
Nov 21<br />
Dec 20<br />
Jan 22<br />
Feb 22<br />
FLEET SIZE GROWTH<br />
Thailand<br />
Malaysia<br />
Singapore<br />
Business Jet Turbine Helicopter Turboprop*<br />
56<br />
48<br />
37<br />
64<br />
57<br />
40<br />
63<br />
59<br />
35<br />
2017 2018 2019 2020 2021<br />
61<br />
57<br />
34<br />
62<br />
50<br />
36<br />
157<br />
111<br />
6<br />
161<br />
111<br />
6<br />
139<br />
110<br />
6<br />
136<br />
101<br />
0<br />
131<br />
100<br />
0<br />
2017 2018 2019 2020 2021<br />
2017 2018 2019 2020 2021<br />
42<br />
34<br />
5<br />
44<br />
28<br />
9<br />
25<br />
19<br />
8<br />
25<br />
18<br />
9<br />
25<br />
19<br />
10<br />
Data Source : The business jet and helicopter fleet: <strong>Asian</strong> <strong>Sky</strong> Group’s Business Jet Fleet Report & Helicopter Fleet Report, Turboprop data provided by AMSTAT.<br />
The current fleet data is preliminary, all fleet size data will be finalized in the upcoming Helicopter / Business Jet Fleet Report.<br />
* Historical data under review<br />
FIRST QUARTER <strong>2022</strong> — ASIAN SKY QUARTERLY | 15
MOOD & INTENTIONS: ECONOMICS<br />
SOUTHEAST ASIA<br />
| INDONESIA, PHILIPPINES & VIETNAM<br />
Indonesia<br />
The economy in Indonesia bounced back in 2021<br />
following a year of negative growth. Full year GDP<br />
growth reached 3.69%, up from a 2.07% contraction<br />
the year before. Stronger commodity prices drove<br />
record exports throughout the year, especially in the<br />
final quarter. The economy is expected to grow by a<br />
further 5% in <strong>2022</strong>.<br />
GDP GROWTH (BILLION USD)<br />
Indonesia<br />
Philippines<br />
Vietnam<br />
$1,119<br />
$1,016<br />
$1,042<br />
$932<br />
$1,058 $1,059<br />
Philippines<br />
$319<br />
$328<br />
$347<br />
$377<br />
$361<br />
$374<br />
The Philippines economy grew by a revised 5.7% in<br />
2021, up by 0.1% from the originally reported figure.<br />
Most sectors of the economy grew during the year,<br />
especially in the fourth quarter, which saw an increase<br />
in the contribution from industry and services. The<br />
country’s GDP is forecast to grow by 6% in <strong>2022</strong>, and a<br />
further 6.3% in 2023.<br />
$205<br />
$224<br />
$245 $262<br />
$271<br />
2016 2017 2018 2019 2020<br />
PURCHASING MANAGER’S INDEX<br />
Indonesia<br />
Philippines<br />
Vietnam<br />
60.0%<br />
$299<br />
YE2021<br />
*Data Source : Trading Economics<br />
*A reading above 50 indicates an expansion of the manufacturing sector<br />
compared to the previous month; below 50 represents a contraction; while<br />
50 indicates no change.<br />
55.0%<br />
50.0%<br />
45.0%<br />
40.0%<br />
35.0%<br />
Expansion Contraction<br />
30.0%<br />
Feb 22<br />
Jan 22<br />
Dec 20<br />
Nov 21<br />
Oct 21<br />
Sep 21<br />
Aug 21<br />
Jul 21<br />
Jun 21<br />
May 21<br />
Apr 21<br />
Mar 21<br />
Feb 21<br />
FLEET SIZE GROWTH<br />
Indonesia Philippines<br />
Business Jet Turbine Helicopter Turboprop*<br />
53<br />
208<br />
207<br />
219<br />
216<br />
226<br />
117<br />
116<br />
119<br />
121<br />
121<br />
51<br />
49<br />
50<br />
48<br />
46<br />
48<br />
169<br />
47 48<br />
48<br />
162 163<br />
57<br />
59<br />
155 156<br />
62<br />
61<br />
62<br />
2017 2018 2019 2020 2021<br />
2017 2018 2019 2020 2021<br />
2017 2018 2019 2020 2021<br />
Data Source : The business jet and helicopter fleet: <strong>Asian</strong> <strong>Sky</strong> Group’s Business Jet Fleet Report & Helicopter Fleet Report, Turboprop data provided by AMSTAT.<br />
The current fleet data is preliminary, all fleet size data will be finalized in the upcoming Helicopter / Business Jet Fleet Report.<br />
* Historical data under review<br />
16 | ASIAN SKY QUARTERLY — FIRST QUARTER <strong>2022</strong>
& INTENTIONS: ECONOMICS<br />
EAST ASIA & SOUTH ASIA<br />
| JAPAN, SOUTH KOREA & INDIA<br />
MOOD<br />
Japan<br />
The economy in Japan grew by 1.7% in 2021, following<br />
two years of contraction. This was largely fueled<br />
by a solid fourth quarter after the country lifted its<br />
COVID-19 related state of emergency in September.<br />
This helped increased domestic consumption, as well<br />
as boosting the transportation sector.<br />
South Korea<br />
GDP GROWTH (BILLION USD)<br />
Japan<br />
$2,295<br />
$2,651<br />
South Korea<br />
$2,701<br />
India<br />
$4,923 $4,867<br />
$4,955 $5,065 $5,013 $5,013<br />
$2,871<br />
$2,623<br />
$2,260<br />
South Korea’s economy grew by 4.1% in 2021, with<br />
growth seen across most major sectors. This was<br />
especially noticeable in the export sector, which<br />
grew by 26% during the year, with exports to China<br />
increasing by 23%. South Korea forecasts its growth in<br />
<strong>2022</strong> will reach 3.1%.<br />
$1,500 $1,624<br />
$1,725 $1,647<br />
$1,631<br />
2016 2017 2018 2019 2020<br />
$1,678<br />
YE2021<br />
India<br />
India’s GDP for 2021 was revised downwards from<br />
9.2% to 8.9% following a decline in construction<br />
contracts. Mining and public admin & defense were<br />
the biggest sectors to grow during the year. India’s<br />
economy is expected to grow by 7.5% in <strong>2022</strong>.<br />
*Data Source : Trading Economics<br />
*A reading above 50 indicates an expansion of the manufacturing sector<br />
compared to the previous month; below 50 represents a contraction; while<br />
50 indicates no change.<br />
PURCHASING MANAGER’S INDEX<br />
Japan<br />
South Korea<br />
India<br />
60.0%<br />
58.0%<br />
56.0%<br />
54.0%<br />
52.0%<br />
50.0%<br />
48.0%<br />
46.0%<br />
44.0%<br />
42.0%<br />
40.0%<br />
Sep 21<br />
Aug 21<br />
Jul 21<br />
Jun 21<br />
May 21<br />
Apr 21<br />
Mar 21<br />
Feb 21<br />
Oct 21<br />
Nov 21<br />
Dec 20<br />
Jan 22<br />
Feb 22<br />
Expansion Contraction<br />
FLEET SIZE GROWTH<br />
Japan<br />
South Korea<br />
India<br />
Business Jet Turbine Helicopter Turboprop*<br />
140<br />
140<br />
138<br />
137<br />
140<br />
647<br />
646<br />
664 673<br />
680<br />
155<br />
155<br />
94<br />
92<br />
78<br />
73<br />
77<br />
76<br />
73<br />
68<br />
54<br />
21<br />
55<br />
19<br />
63<br />
21<br />
57<br />
17<br />
65<br />
20<br />
291<br />
227<br />
287<br />
229<br />
285 288<br />
232 231<br />
284<br />
229<br />
16<br />
19<br />
17<br />
17<br />
19<br />
2017 2018 2019 2020 2021<br />
2017 2018 2019 2020 2021<br />
2017 2018 2019 2020 2021<br />
Data Source : The business jet and helicopter fleet: <strong>Asian</strong> <strong>Sky</strong> Group’s Business Jet Fleet Report & Helicopter Fleet Report, Turboprop data provided by AMSTAT.<br />
The current fleet data is preliminary, all fleet size data will be finalized in the upcoming Helicopter / Business Jet Fleet Report.<br />
* Historical data under review<br />
FIRST QUARTER <strong>2022</strong> — ASIAN SKY QUARTERLY | 17
MOOD & INTENTIONS: QUARTERLY SURVEY<br />
QUARTERLY SURVEY<br />
RESPONDENT BREAKDOWN<br />
Highlights in <strong>2022</strong> <strong>Q1</strong> Survey<br />
Respondent’s Locations<br />
Rest of the World (9%)<br />
SE & NE Asia (21%)<br />
Greater China (27%)<br />
Top 10 Respondent’s Locations<br />
Oceania (8%)<br />
Central Asia &<br />
Middle East (35%)<br />
1. Chinese market optimism dropped by 21% in <strong>Q1</strong>,<br />
which led to a decrease in regional optimism for the<br />
first time since 2020 <strong>Q1</strong>.<br />
2. More respondents believed that market demand will<br />
bounce back in the next six months.<br />
3. Fleet utilization continues to increase.<br />
4. Common sense regarding the “Seller’s Market” remains.<br />
In the first quarter of <strong>2022</strong> over 350 business<br />
aviation professionals responded to <strong>Asian</strong> <strong>Sky</strong><br />
Media’s latest quarterly survey about the mood and<br />
intentions in the industry.<br />
Singapore (5%)<br />
Thailand (5%)<br />
Australia (6%)<br />
Indonesia (6%)<br />
Philippines (6%)<br />
Pakistan (7%)<br />
United Arab Emirates (9%)<br />
United States (4%)<br />
China (18%)<br />
India (18%)<br />
Hong Kong (16%)<br />
The regions with the most respondents include:<br />
1. Greater China (27%) 2. Southeast and Northeast<br />
Asia (21%) 3. Central Asia & the Middle East (35%,<br />
incl. India, Pakistan, UAE etc.) 4. Oceania (8%) 5. Rest<br />
of the world (9%).<br />
The majority (61%) of respondents are related to<br />
business jets operations.<br />
Respondent’s Related Aircraft Type<br />
Turboprop (19%)<br />
Civil Helicopter (20%)<br />
Business Jet (61%)<br />
In total, 61% of respondents from this survey are<br />
from aircraft services providers (FBO, MRO, etc.)<br />
and aircraft operators. This was followed by smaller<br />
percentages of aircraft brokers (16%), and aircraft<br />
end users (5%). The remainder of the respondents are<br />
from other associated areas.<br />
COVID-19 Pandemic in Asia-Pacific<br />
Respondent’s Category<br />
Aircraft Sales / Charter Broker (16%)<br />
Others (18%)<br />
Aircraft Owner / Charter User (5%)<br />
Aircraft Service Providers*<br />
(FBO, MRO, etc) (32%)<br />
In the first quarter of <strong>2022</strong>, as the borders between<br />
countries and regions in Asia-Pacific continue to open<br />
up, we have seen a promising, increased percentage<br />
of respondents believing that market demand will be<br />
back in the next six months. This is an opinion that is<br />
supported by respondent’s own flight operations and<br />
business inquiries.<br />
Aircraft Operator<br />
/Management Company (29%)<br />
* Aircraft Service Providers include: financial services, training, FBO, ground<br />
handlers, Service, MRO, parts, etc.<br />
** Others include law firms, research facilities and government officials<br />
18 | ASIAN SKY QUARTERLY — FIRST QUARTER <strong>2022</strong>
MOOD & INTENTIONS: QUARTERLY SURVEY<br />
All signs are good, except in the Greater<br />
China market. A major COVID-19 outbreak hit<br />
Hong Kong during December-January which<br />
shelved the Hong Kong government’s efforts<br />
to open its border with mainland China again.<br />
Mainland China itself was later hit by another<br />
COVID-19 wave, with Shanghai facing the<br />
brunt, forcing the city into total lockdown.<br />
This seriously affected fleet utilization in the<br />
region, as well as domestic business demand.<br />
When asking for people’s understanding of<br />
the current economic cycle in Asia-Pacific,<br />
we saw optimism reach 76%, which is a 10%<br />
decrease compared to the previous quarter.<br />
This is the first major decrease we have seen<br />
since <strong>Q1</strong> 2020, when the COVID-19 outbreak<br />
first took place.<br />
Aircraft Utilization<br />
According to WingX Advance, a German<br />
business aviation consultancy firm, flight<br />
activity increased during the first quarter<br />
across Asia-Pacific, except for regional cities<br />
in Greater China. From our survey, a total of<br />
57% of respondents reported that their fleet<br />
utilization increased. Overall, most regions’<br />
respondents believe that market demand was<br />
higher in <strong>Q1</strong> <strong>2022</strong> than it was in <strong>Q1</strong> 2021,<br />
except in the Greater China market.<br />
Purchase Intentions<br />
COVID-19 IMPACT IN ASIA-PACIFIC<br />
Has the COVID-19 outbreak affected you or your<br />
organization’s business so far?<br />
6%<br />
3%<br />
Do you foresee market demand bouncing back in the 2nd<br />
half-year of <strong>2022</strong>/1st half year of 2023?<br />
40%<br />
24%<br />
36%<br />
2020<strong>Q1</strong><br />
2020Q2<br />
2020Q3<br />
2020Q4<br />
2021<strong>Q1</strong><br />
2021Q2<br />
2021Q3<br />
2021Q4<br />
<strong>2022</strong><strong>Q1</strong><br />
1%<br />
2%<br />
2%<br />
0%<br />
Hard to tell<br />
Hard to tell at the moment<br />
38%<br />
27%<br />
35%<br />
1%<br />
1%<br />
5%<br />
4%<br />
38%<br />
29%<br />
34%<br />
1%<br />
3%<br />
1%<br />
5%<br />
Not affected<br />
5%<br />
5%<br />
5%<br />
5%<br />
36%<br />
32%<br />
33%<br />
No<br />
27%<br />
44%<br />
30%<br />
63%<br />
Yes<br />
68%<br />
72%<br />
71%<br />
68%<br />
72%<br />
65%<br />
66%<br />
62%<br />
Seriously affected<br />
33%<br />
41%<br />
26%<br />
32%<br />
38%<br />
31%<br />
27%<br />
28%<br />
25%<br />
24%<br />
25%<br />
23%<br />
29%<br />
27%<br />
Somewhat affected<br />
30%<br />
37%<br />
33%<br />
28%<br />
62%<br />
12%<br />
26%<br />
Respondents falling into the broker category<br />
have reported that we are in a seller’s market<br />
for three consecutive quarters, with this<br />
quarter reaching 55%.<br />
2020<strong>Q1</strong><br />
2020Q2<br />
2020Q3<br />
2020Q4<br />
2021<strong>Q1</strong><br />
2021Q2<br />
2021Q3<br />
2021Q4<br />
Rank the following factors that you think are critical to the<br />
future of business aviation / general aviation:<br />
<strong>2022</strong><strong>Q1</strong><br />
There has been an uptick in new purchase<br />
intentions from our respondents, which<br />
Customer Service<br />
2.6<br />
is now at 30%. This is a good sign that<br />
operators / aircraft owners are thinking of<br />
either upgrading or adding new aircraft, to<br />
their fleets.<br />
Cabin Sanitation<br />
Privacy<br />
3.8<br />
3.6<br />
3.5<br />
Value for Price Paid<br />
2.6<br />
2.8<br />
Most Important<br />
Flexibility / Punctuality<br />
Maintenance Support<br />
FIRST QUARTER <strong>2022</strong> — ASIAN SKY QUARTERLY | 19
MOOD & INTENTIONS: QUARTERLY SURVEY<br />
In terms of your current level of business recovery, how does your domestic business volume compare to<br />
your international business volume?<br />
100%<br />
International business recovery is<br />
better than domestic<br />
90%<br />
80%<br />
70%<br />
25%<br />
2%<br />
10%<br />
25%<br />
13%<br />
44%<br />
21%<br />
3%<br />
16%<br />
My business has not been affected<br />
by COVID-19 so far<br />
Hard to tell at the moment<br />
Domestic business recovery is better<br />
than international<br />
60%<br />
50%<br />
40%<br />
30%<br />
20%<br />
47%<br />
19%<br />
38%<br />
4%<br />
11%<br />
28%<br />
49%<br />
Neither have not started to recover<br />
10%<br />
0%<br />
16%<br />
Aircraft Operator / Management<br />
Company<br />
6%<br />
Aircraft Owner /<br />
Charter User<br />
13%<br />
Aircraft Sales /<br />
Charter Broker<br />
12%<br />
Other Related<br />
(FBO, MRO, etc)<br />
ECONOMIC STATUS<br />
Optimism Levels - Regional Differences<br />
Greater China Central Asia & Middle East SE & NE Asia Oceania Overall<br />
100%<br />
90%<br />
80%<br />
70%<br />
60%<br />
50%<br />
40%<br />
81%<br />
75%<br />
66%<br />
56%<br />
84%<br />
71%<br />
60%<br />
58%<br />
45%<br />
89%<br />
73%<br />
62%<br />
55%<br />
83%<br />
70%<br />
60%<br />
59%<br />
67%<br />
58%<br />
50%<br />
53%<br />
52%<br />
44%<br />
41%<br />
75%<br />
74%<br />
71%<br />
70%<br />
62%<br />
77%<br />
75%<br />
70%<br />
68%<br />
95%<br />
84%<br />
83%<br />
73%<br />
89%<br />
86%<br />
85%<br />
83%<br />
89%<br />
83%<br />
80%<br />
69%<br />
91% 92%<br />
83% 83%<br />
81%<br />
73%<br />
67%<br />
60%<br />
37%<br />
30%<br />
31%<br />
29%<br />
30%<br />
20%<br />
20%<br />
2019<strong>Q1</strong><br />
2019Q2<br />
2019Q3<br />
2019Q4<br />
2020<strong>Q1</strong><br />
2020Q2<br />
2020Q3<br />
2020Q4<br />
2021<strong>Q1</strong><br />
2021Q2<br />
2021Q3 2021Q4 <strong>2022</strong><strong>Q1</strong><br />
20 | ASIAN SKY QUARTERLY — FIRST QUARTER <strong>2022</strong>
MOOD & INTENTIONS: QUARTERLY SURVEY<br />
What is the current economic status? (<strong>Quarterly</strong> comparsion)<br />
Past Low Point<br />
30%<br />
31%<br />
30%<br />
35%<br />
19%<br />
23%<br />
26%<br />
27%<br />
30%<br />
41%<br />
40%<br />
40% 44%<br />
Optimistic<br />
(Will get better)<br />
31%<br />
29%<br />
36%<br />
29%<br />
32%<br />
24%<br />
45%<br />
40%<br />
At Low Point<br />
54%<br />
42%<br />
45%<br />
46%<br />
32%<br />
Pessimistic<br />
(Will get worse)<br />
34%<br />
40%<br />
38%<br />
41%<br />
50%<br />
48%<br />
29%<br />
32%<br />
16%<br />
17%<br />
15%<br />
14% 24%<br />
Not Reached Low Point<br />
2019<strong>Q1</strong><br />
2019Q2<br />
2019Q3<br />
2019Q4<br />
2020<strong>Q1</strong><br />
2020Q2<br />
2020Q3<br />
2020Q4<br />
2021<strong>Q1</strong><br />
2021Q2<br />
2021Q3<br />
2021Q4<br />
<strong>2022</strong><strong>Q1</strong><br />
PURCHASE INTENTIONS<br />
Where are we in the current pre-owned market?<br />
Buyer’s Market<br />
41%<br />
58%<br />
50%<br />
55%<br />
66%<br />
54%<br />
62%<br />
62%<br />
48%<br />
52%<br />
58%<br />
58%<br />
55%<br />
Balanced Market<br />
Seller’s Market<br />
I’m not sure<br />
38%<br />
16%<br />
5%<br />
20%<br />
15%<br />
8%<br />
28%<br />
17%<br />
6%<br />
21%<br />
15%<br />
9%<br />
13%<br />
12%<br />
8%<br />
22%<br />
13%<br />
11%<br />
18%<br />
13%<br />
8%<br />
17%<br />
10%<br />
30%<br />
15%<br />
8%<br />
29%<br />
19%<br />
0%<br />
26%<br />
16%<br />
0%<br />
26%<br />
16%<br />
0%<br />
18%<br />
12%<br />
16%<br />
2019<br />
<strong>Q1</strong><br />
2019<br />
Q2<br />
2019<br />
Q3<br />
2019<br />
Q4<br />
2020<br />
<strong>Q1</strong><br />
2020<br />
Q2<br />
2020<br />
Q3<br />
2020<br />
Q4<br />
2021<br />
<strong>Q1</strong><br />
2021<br />
Q2<br />
2021<br />
Q3<br />
2021<br />
Q4<br />
<strong>2022</strong><br />
<strong>Q1</strong><br />
Purchase Intention 2019<strong>Q1</strong> - <strong>2022</strong><strong>Q1</strong><br />
52.9%<br />
58.8%<br />
57.8%<br />
54.9%<br />
55.6%<br />
52.1%<br />
52.7%<br />
55.0%<br />
Yes, a new aircraft<br />
43.3%<br />
45.7%<br />
48.2%<br />
48.5%<br />
45.5%<br />
Yes, a pre-owned aircraft<br />
No/I’m not sure<br />
28.5%<br />
28.1%<br />
27.4%<br />
26.9%<br />
26.7%<br />
20.4%<br />
28.0%<br />
26.4%<br />
23.8% 25.1%<br />
21.9% 22.0%<br />
19.3%<br />
20.2%<br />
23.2%<br />
21.9%<br />
22.4%<br />
22.0%<br />
25.8%<br />
22.0%<br />
24.1%<br />
23.2%<br />
23.3%<br />
21.8%<br />
30.3%<br />
24.2%<br />
2019<br />
<strong>Q1</strong><br />
2019<br />
Q2<br />
2019<br />
Q3<br />
2019<br />
Q4<br />
2020<br />
<strong>Q1</strong><br />
2020<br />
Q2<br />
2020<br />
Q3<br />
2020<br />
Q4<br />
2021<br />
<strong>Q1</strong><br />
2021<br />
Q2<br />
2021<br />
Q3<br />
2021<br />
Q4<br />
<strong>2022</strong><br />
<strong>Q1</strong><br />
FIRST QUARTER <strong>2022</strong> — ASIAN SKY QUARTERLY | 21
MOOD & INTENTIONS: QUARTERLY SURVEY<br />
Regional Differences (Fixed Wing)<br />
Corporate Airliner<br />
Large Jet<br />
Mid-size Jet<br />
Light Jet<br />
Turboprop / Piston Fixed Wing<br />
Southeast &<br />
Northeast Asia<br />
18% 29%<br />
26%<br />
16%<br />
11%<br />
Oceania<br />
11% 21%<br />
42%<br />
16%<br />
11%<br />
Greater China<br />
9% 50%<br />
17%<br />
13%<br />
11%<br />
Central Asia &<br />
Middle East<br />
29%<br />
12% 24% 20%<br />
16%<br />
Purchase Intention - Fixed Wing<br />
Purchase Intention - Helicopters<br />
Corporate Airliner<br />
(Such as ACJ, BBJ)<br />
Twin Turbine<br />
(Such as Sikorsky S-76C+)<br />
Most Preferred<br />
Turboprop/Piston<br />
Fixed Wing<br />
(Such as King Air Series)<br />
Large Jet<br />
(Such as G650,<br />
Falcon 8X)<br />
Most Preferred<br />
Small Jet<br />
(Such as Citation Series,<br />
Hawker Series)<br />
Midsized Jet<br />
(Such as Challenger 650)<br />
Piston Helicopter<br />
(Such as Robinson R22)<br />
Single Turbine Helicopter<br />
(Such as Bell 206)<br />
Purchase Decisions - Influencing Factors*<br />
Government / Public Opinion<br />
Greater China<br />
Oceania<br />
Inconvenient to Use<br />
No Interesting Aircraft<br />
Central Asia & Middle East<br />
SE & NE Asia<br />
Most Limited<br />
No Need<br />
Price<br />
*Outer means more limited<br />
22 | ASIAN SKY QUARTERLY — FIRST QUARTER <strong>2022</strong>
MOOD & INTENTIONS: QUARTERLY SURVEY<br />
FLEET UTILIZATION<br />
Aircraft Utilization Changes in Past Two Years<br />
100%<br />
50%<br />
0%<br />
Up by 20%<br />
and more<br />
(>20%)<br />
Up but less<br />
than 20%<br />
(0 - 20%)<br />
The same<br />
(0%)<br />
Down<br />
but less<br />
than 20%<br />
(-20 - 0%)<br />
Down<br />
by 20%<br />
or more<br />
(
The International Aircraft Dealers Association<br />
is the collective force influencing and shaping the<br />
aircraft transaction industry.<br />
Experience the power of the collective.<br />
AIRCRAFTEXCHANGE.COM
IADA<br />
MARKET<br />
REPORT<br />
FIRST QUARTER<br />
<strong>2022</strong><br />
WAYNE STARLING<br />
Executive Director, IADA<br />
On behalf of IADA, I’m proud to present the first quarter <strong>2022</strong> IADA<br />
Market Report.<br />
As everyone knows, we live in tumultuous times. Despite that, the<br />
aviation field continues to show extraordinary strength. Global<br />
demand is very high. And, much like the fourth quarter of 2021, that<br />
demand is married to constrained inventory levels. From a qualitative<br />
point of view, our members sense a softening of those constraints and<br />
look forward to greater inventory levels as the year progresses.<br />
IADA members report a 35.2% increase in closed deals compared with<br />
the first quarter of 2021.<br />
IADA Accredited Dealers buy and sell more aircraft by dollar volume<br />
than the rest of the world’s dealers combined. This global impact and<br />
input help to make the IADA Market Report the go-to review of the<br />
business aircraft market. Two important factors make up the report:<br />
The first is the IADA Accredited Dealers’ market perspective taken<br />
from a survey of the entire IADA membership. The second is actual<br />
sales data supplied by IADA members to support those points of view;<br />
IADA Accredited Dealers submit monthly transaction and activities to<br />
IADA’s online sales organization, AircraftExchange.<br />
There is great power in our collective. IADA dealers continue to<br />
transact sales even when inventory levels are at historically low levels.<br />
We will be conducting the IADA Perspective Survey at the end of each<br />
quarter and will present results, along with sales data, at the beginning<br />
of the following quarter.<br />
IADA wishes you continued success throughout <strong>2022</strong>.<br />
FIRST QUARTER <strong>2022</strong> — ASIAN SKY QUARTERLY | 25
IADA MARKET REPORT<br />
GENERAL MARKET CONDITIONS<br />
The following data is derived from questions that measure<br />
members’ overall perspectives on the future of the used aircraft<br />
sales market over the next six months, including finance, leasing<br />
and commissions. Responses are reported on a 1-5 scale, with 1<br />
meaning “worst ever” and 5 meaning “best ever.”<br />
Respondents report that current market conditions are “better than<br />
normal” for <strong>Q1</strong>. Current market conditions are driven by a near-total<br />
lack of inventory and high demand.<br />
OVERALL MARKET CONDITIONS | <strong>Q1</strong> YEAR OVER YEAR<br />
<strong>Q1</strong> <strong>2022</strong> <strong>Q1</strong> 2021<br />
What is your assessment of the current<br />
4.1<br />
business aircraft sales market?<br />
3.4<br />
What is your projection for the business<br />
aircraft sales market 6 months from now?<br />
3.4<br />
3.9<br />
Current market sentiment<br />
What is your projection for the aircraft finance<br />
market 6 months from now?<br />
3.4<br />
3.4<br />
is 20% more positive for<br />
<strong>Q1</strong> <strong>2022</strong> versus <strong>Q1</strong> 2021.<br />
The 6 month outlook is<br />
less certain.<br />
What is your projection for the aircraft leasing<br />
market 6 months from now?<br />
3.1<br />
3.4<br />
OVERALL MARKET CONDITIONS FOR SALES, FINANCE, LEASING AND COMMISSIONS<br />
What is your assessment of the current business aircraft sales market?<br />
2021 MEAN 2020 MEAN<br />
BEST EVER<br />
NORMAL<br />
WORST EVER<br />
0-.9 1-1.9 2-2.9 3-3.9 4-5<br />
3.9<br />
4.3<br />
4.1 4.1<br />
3.9<br />
3.4<br />
Q2 2021 MEAN Q3 2021 MEAN Q4 2021 MEAN <strong>Q1</strong> <strong>2022</strong> MEAN<br />
26 | ASIAN SKY QUARTERLY — FIRST QUARTER <strong>2022</strong>
IADA MARKET REPORT<br />
What is your projection for the business aircraft sales market 6 months from now?<br />
2021 MEAN 2020 MEAN<br />
BEST EVER<br />
NORMAL<br />
WORST EVER<br />
0-.9 1-1.9 2-2.9 3-3.9 4-5<br />
3.8 3.8 3.8 3.9<br />
3.7<br />
3.1<br />
Q2 2021 MEAN Q3 2021 MEAN Q4 2021 MEAN <strong>Q1</strong> <strong>2022</strong> MEAN<br />
What is your projection for the aircraft finance market 6 months from now?<br />
2021 MEAN 2020 MEAN<br />
BEST EVER<br />
NORMAL<br />
WORST EVER<br />
0-.9 1-1.9 2-2.9 3-3.9 4-5<br />
3.5 3.4<br />
3.2<br />
3.4<br />
3.3<br />
3.0<br />
Q2 2021 MEAN Q3 2021 MEAN Q4 2021 MEAN <strong>Q1</strong> <strong>2022</strong> MEAN<br />
What is your projection for the aircraft leasing market 6 months from now?<br />
2021 MEAN 2020 MEAN<br />
BEST EVER<br />
NORMAL<br />
WORST EVER<br />
0-.9 1-1.9 2-2.9 3-3.9 4-5<br />
3.1<br />
3.2<br />
3.1 3.1<br />
3.1<br />
2.7<br />
Q2 2021 MEAN Q3 2021 MEAN Q4 2021 MEAN <strong>Q1</strong> <strong>2022</strong> MEAN<br />
FIRST QUARTER <strong>2022</strong> — ASIAN SKY QUARTERLY | 27
IADA MARKET REPORT<br />
6-MONTH MARKET SECTOR OUTLOOK<br />
The <strong>Q1</strong> responses predict the next six months will continue to<br />
bring increases in demand for all sectors of the used aircraft sales<br />
market — turboprop, light, medium and large/ULJ — while inventory<br />
deficiencies (supply shortfalls) are projected to drive higher prices.<br />
PROJECTIONS FOR THE PRE-OWNED TURBOPROP MARKET FOR THE NEXT 6 MONTHS<br />
Pricing Supply Willingness to Inventory Demand<br />
Q2 2021 MEAN Q3 2021 MEAN Q4 2021 MEAN <strong>Q1</strong> <strong>2022</strong> MEAN<br />
SIGNIFICANT<br />
INCREASE<br />
4.1<br />
SLIGHT<br />
INCREASE<br />
STABLE<br />
3.8<br />
3.5<br />
3.3<br />
2.3<br />
4.0<br />
3.5<br />
3.8<br />
3.8<br />
3.4<br />
2.5<br />
3.8<br />
3.8<br />
3.2<br />
2.4<br />
1.9<br />
SLIGHT<br />
DECREASE<br />
SIGNIFICANT<br />
DECREASE<br />
PROJECTIONS FOR THE PRE-OWNED LIGHT-JET MARKET FOR THE NEXT 6 MONTHS<br />
Pricing Supply Willingness to Inventory Demand<br />
Q2 2021 MEAN Q3 2021 MEAN Q4 2021 MEAN <strong>Q1</strong> <strong>2022</strong> MEAN<br />
SIGNIFICANT<br />
INCREASE<br />
SLIGHT<br />
INCREASE<br />
3.9<br />
3.6<br />
3.5<br />
4.0<br />
4.0<br />
3.5<br />
4.0<br />
4.0<br />
3.7<br />
3.8<br />
3.8<br />
3.3<br />
STABLE<br />
2.5<br />
2.4<br />
2.6<br />
1.9<br />
SLIGHT<br />
DECREASE<br />
SIGNIFICANT<br />
DECREASE<br />
28 | ASIAN SKY QUARTERLY — FIRST QUARTER <strong>2022</strong>
IADA MARKET REPORT<br />
PROJECTIONS FOR THE PRE-OWNED MID-SIZE MARKET FOR THE NEXT 6 MONTHS<br />
Pricing Supply Willingness to Inventory Demand<br />
Q2 2021 MEAN Q3 2021 MEAN Q4 2021 MEAN <strong>Q1</strong> <strong>2022</strong> MEAN<br />
SIGNIFICANT<br />
INCREASE<br />
SLIGHT<br />
INCREASE<br />
3.8<br />
3.6<br />
3.5<br />
4.0<br />
4.0<br />
3.5<br />
4.0<br />
3.9<br />
3.6<br />
3.9<br />
3.9<br />
3.1<br />
2.7<br />
STABLE<br />
2.3<br />
2.0<br />
2.4<br />
SLIGHT<br />
DECREASE<br />
SIGNIFICANT<br />
DECREASE<br />
PROJECTIONS FOR THE PRE-OWNED LARGE AND ULTRA-LONG-RANGE JET MARKET<br />
FOR THE NEXT 6 MONTHS<br />
Pricing Supply Willingness to Inventory Demand<br />
Q2 2021 MEAN Q3 2021 MEAN Q4 2021 MEAN <strong>Q1</strong> <strong>2022</strong> MEAN<br />
SIGNIFICANT<br />
INCREASE<br />
SLIGHT<br />
INCREASE<br />
3.7<br />
3.4<br />
3.3<br />
3.9<br />
3.8<br />
3.2<br />
3.9<br />
3.6<br />
3.2<br />
3.6<br />
3.5<br />
2.9<br />
STABLE<br />
2.2<br />
2.0<br />
2.4<br />
2.7<br />
SLIGHT<br />
DECREASE<br />
SIGNIFICANT<br />
DECREASE<br />
FIRST QUARTER <strong>2022</strong> — ASIAN SKY QUARTERLY | 29
IADA MARKET REPORT<br />
MONTHLY ACTIVITY REPORTS<br />
The perspectives and projections from IADA Members for the<br />
IADA Market Report are supported by the monthly transaction/<br />
activity reports submitted by IADA Accredited Dealers through<br />
AircraftExchange.<br />
Please note that, in addition to sales data from AircraftExchange<br />
listings, the IADA Market Report includes data from all IADA<br />
Accredited Dealer activities and transactions, reported in total.<br />
Herein is a summary of those reports.<br />
DEALER ACTIVITY | <strong>Q1</strong> YEAR OVER YEAR<br />
<strong>Q1</strong> <strong>2022</strong> <strong>Q1</strong> 2021<br />
NEW ACQUISITION AGREEMENTS<br />
121<br />
223<br />
RETAINED TO SELL EXCLUSIVELY<br />
155<br />
157<br />
Closed deals increased<br />
LOWERED PRICE<br />
6<br />
27<br />
by 35% compared with<br />
<strong>Q1</strong> 2021.<br />
FELL APART<br />
41<br />
45<br />
UNDER CONTRACT<br />
248<br />
259<br />
CLOSED DEALS<br />
213<br />
288<br />
IADA DEALER ACTIVITY YEAR-TO-DATE COMPARISON<br />
2021 <strong>Q1</strong> YTD 2021 YEAR TOTAL<br />
<strong>2022</strong> <strong>Q1</strong> YTD<br />
NEW ACQUISITION AGREEMENTS<br />
121<br />
223<br />
698<br />
RETAINED TO SELL EXCLUSIVELY<br />
157<br />
155<br />
552<br />
LOWERED PRICE<br />
27<br />
6<br />
50<br />
FELL APART<br />
41<br />
45<br />
160<br />
UNDER CONTRACT<br />
248<br />
259<br />
1245<br />
CLOSED DEALS<br />
213<br />
288<br />
1370<br />
30 | ASIAN SKY QUARTERLY — FIRST QUARTER <strong>2022</strong>
IADA MARKET REPORT<br />
IADA DEALER ACTIVITY REPORT<br />
Q2 2021 Q3 2021 Q4 2021 <strong>Q1</strong> <strong>2022</strong><br />
NEW ACQUISITION AGREEMENTS<br />
177<br />
190<br />
210<br />
223<br />
<strong>Q1</strong> ‘22<br />
223<br />
RETAINED TO SELL EXCLUSIVELY<br />
133<br />
128<br />
134<br />
155<br />
<strong>Q1</strong> ‘22<br />
155<br />
LOWERED PRICE<br />
11<br />
7<br />
5<br />
6<br />
<strong>Q1</strong> ‘22<br />
6<br />
FELL APART<br />
40<br />
40<br />
39<br />
45<br />
<strong>Q1</strong> ‘22<br />
45<br />
UNDER CONTRACT<br />
330<br />
360<br />
307<br />
259<br />
<strong>Q1</strong> ‘22<br />
259<br />
CLOSED DEALS<br />
316<br />
340<br />
501<br />
288<br />
<strong>Q1</strong> ‘22<br />
288<br />
TOTAL CLOSED DEALS BY QUARTER<br />
2020 2021 <strong>2022</strong><br />
554<br />
501<br />
288<br />
316<br />
283<br />
340<br />
124<br />
213<br />
174<br />
<strong>Q1</strong> Q2 Q3 Q4<br />
FIRST QUARTER <strong>2022</strong> — ASIAN SKY QUARTERLY | 31
SPONSORED CONTENT<br />
SPECTRUM AEROMED’S<br />
AIRCRAFT MEDICAL SOLUTIONS<br />
Founded in 1991, North Dakota-based Spectrum Aeromed specializes in providing air medical and air ambulance<br />
interiors for rescue helicopters and fixed-wing aircraft.<br />
Dedicated to saving lives, Spectrum Aeromed wants to be the<br />
number one provider of air ambulance equipment in the world.<br />
To achieve this, it provides a variety of solutions for helicopters<br />
and fixed-wing aircraft that can also be tailored technically and<br />
aesthetically to the customer. Thomas Redder, the company’s<br />
VP of International Sales says that Spectrum Aeromed can<br />
customize aircraft based on different mission objectives, citing<br />
military medical evacuations, hospital transfers, and road accident<br />
evacuations. Altogether, Spectrum Aeromed has developed<br />
customized solutions for all segments of the global aviation<br />
industry including air charter services, private/VIP operators,<br />
emergency medical services, search and rescue operations,<br />
hospitals, corporations, and military and government programs.<br />
medical service configuration in about 15 minutes, without the<br />
need for any special tools. As such, the module makes it quicker<br />
and easier for medical personnel to serve those in need.<br />
The 20/2200 module, otherwise known as the ‘shortbox’, is similar<br />
to the 2800 series. The one difference is that its flexibility ensures<br />
it is especially well-suited to being placed in smaller aircraft or<br />
aircraft with limited floor space. The stretcher is designed with<br />
tapered corners to allow it to fit through narrow doors or cabinets<br />
that hinder the amount it can turn when loading or unloading.<br />
Overall, both modules can also be installed either as a single<br />
stretcher or in a group configuration, depending on the interior<br />
space of the cabin.<br />
When it comes to fixed-wing aircraft solutions, Spectrum<br />
Aeromed has several stretcher solutions. The 2800 stretcher is<br />
lightweight and can fit in both small and large aircraft. It is also<br />
flame retardant, with an adjustable backrest, thick foam pad, and<br />
expandable armrests to increase the patient’s comfort, as well<br />
as allow the medical crew to better care for and access them. It<br />
comes with a unique seat rail adaptor as an additional feature,<br />
that can immediately help convert the aircraft into its emergency<br />
Spectrum Aeromed has expertise in carbon fiber lightweight<br />
designs for customers that require heavy duty capabilities. The<br />
5500 Module was designed for larger executive-style aircraft such<br />
as a Boeing or Airbus A320, and the 3200 Series Patient Transport<br />
Unit offers customers a custom module with many critical care<br />
capabilities. Spectrum Aeromed’s specialty equipment includes<br />
manual and electric patient loading systems, medical equipment<br />
mounts, cabinets, equipment tables, an incubator transport<br />
32 | ASIAN SKY QUARTERLY — FIRST QUARTER <strong>2022</strong>
SPONSORED CONTENT<br />
their existing equipment. This upgrade is possible as most of<br />
Spectrum Aeromed’s equipment is compatible with each other.<br />
This contrasts with other medical equipment manufacturers, which<br />
might be cheaper but cannot be changed without complications.<br />
And if a customer wants to keep their previous module? No<br />
worries — as Redder puts it, “ you can also keep the old module as<br />
secondary equipment.” This can benefit patients too, especially if<br />
both need to be transported using a stretcher but have different<br />
medical needs.<br />
system for caring for infants, IV poles and oxygen boxes. Unique to<br />
Spectrum Aeromed, the exclusively designed Medwall, Moveable<br />
Overhead and Stretcher Bridge were made for the direct mounting<br />
of auxiliary medical equipment to provide easy access and<br />
flexibility for medical crews.<br />
With rotor and helicopter solutions, Spectrum Aeromed includes<br />
its Articulating Stretcher model. It can be pivoted from a full<br />
extension to a locked position. As such, aircraft crew and medical<br />
team members barely need to do any heavy lifting.<br />
Spectrum Aeromed recently launched a new product called the<br />
Infinity 5000X. According to Redder it is; “designed for a more<br />
versatile operation so that it can be used for more applications.”<br />
Unlike the 2800 and 20/2200 models, the Infinity 5000X boasts<br />
improved aesthetics, is easier to access for maintenance, is<br />
lighter in weight, and is built and designed for flight nurses and<br />
air medical teams specifically. The newly designed stretcher<br />
bridge allows better access to patients, especially when patients<br />
need to be carried on and off the stretcher. Even more convenient,<br />
additional options and accessories like a medwall, medical<br />
equipment mounts or an Infant Transport Deck can be added to<br />
the module. When it comes to future plans regarding this model,<br />
Redder says that Spectrum Aeromed is currently in the process<br />
of certificating the Pilatus PC-12 with the Federal Aviation<br />
Administration (FAA) to hold the new equipment, with hopes that<br />
this will be completed before the end of <strong>2022</strong>.<br />
Aside from stretcher modules, the company further provides<br />
specialty medical equipment and accessories for certain specific<br />
missions. These include its Incubator Transport System (ITS)<br />
for whenever infants are on board, Patient Loaders to transport<br />
patients lying down onto smaller aircraft, as well as medical<br />
equipment mounts. This features defibrillators, monitors, oxygen,<br />
and other equipment needed to support a life support system.<br />
These mounts are also fully customizable, with Spectrum Aeromed<br />
working closely with medical teams to design a system best suited<br />
for the aircraft and mission. Furthermore, users do not need to<br />
worry when it comes to maintenance, as Spectrum Aeromed allows<br />
customers to request new parts through its website. Frequently<br />
requested parts that the company stocks include stretcher pads,<br />
IV poles, oxygen cylinders, and lap belts.<br />
However, as an essential service provider, Spectrum Aeromed has<br />
no doubt been affected by the ongoing COVID-19 pandemic. As<br />
such, the company also includes the option of outfitting aircraft<br />
with a variety of containment and isolation units. These include<br />
ISOVAC Products’ Containment and Protection System Utilizing<br />
Life Support (CAPSULS) Patient Isolation Units (PIU’s), AirBoss<br />
Iso-Pod, and EpiGuards EpiShuttle. These units can be installed<br />
and removed within 30 minutes and can be used on most aircraft<br />
such as Airbus, Boeing, Learjet, King Air, the Agusta AW139,<br />
Bell429, and more.<br />
One of the unique aspects of Spectrum Aeromed’s modules is that<br />
the company is trying to give, according to Redder, “maximum<br />
compatibility.” Whilst some customers may go for the cheapest<br />
solution possible and only buy a regular stretcher for an aircraft,<br />
Spectrum Aeromed’s modules allow its medical systems to be<br />
upgraded at a later stage. As he explains, a customer might first<br />
choose a base, and then later add on accessories such as medical<br />
device mounts or an infant transport deck. Or as the program<br />
grows, they can add more ambulance modules that will fit with<br />
FIRST QUARTER <strong>2022</strong> — ASIAN SKY QUARTERLY | 33
SPONSORED CONTENT<br />
Redder admits that the past few years have, at times, been quite<br />
challenging. At the start of the pandemic, Spectrum Aeromed saw<br />
a spike in stretcher inquiries. As Redder explains, “everyone was<br />
saying that the only transport taking place in the near future would<br />
be patients flying from one hospital to another.” However, with<br />
many airlines stopping operations due to quarantine and flight<br />
restrictions, many flyers pivoted to using old aircraft for private,<br />
VIP transport. “Nowadays, if you want to charter an airplane, most<br />
customers say ‘I don’t need a stretcher, because I can still use my<br />
old airplane for VIP transport,” Redder says. Consequently, it has<br />
been somewhat difficult for Spectrum Aeromed to find aircraft that<br />
want to have medical equipment installed.<br />
Fortunately, as Spectrum Aeromed sells its equipment<br />
internationally, the company can rely on various customers to<br />
balance its turnover. Redder cites the situation in Asia as an<br />
example — as of writing, travel in most places in the region is<br />
slow, especially in mainland China, which is starting to close up<br />
again according to its ‘dynamic zero’ policy. Nevertheless, with any<br />
downswing, there is an upswing — for example, Redder notes that<br />
the United States, in contrast, is opening up and doing well. “So<br />
that kind of worked out well for us,” he says.<br />
The quality level of the types of equipment Spectrum Aeromed<br />
sells also plays a factor in balancing its turnover. Redder cites<br />
India as an example. The company started out selling simple<br />
systems in the region, but over the last two or three years,<br />
after Spectrum Aeromed supplied customers with its intensive<br />
care units, the market is now pivoting towards buying more<br />
sophisticated solutions. “The general trend is that once you<br />
manage to sell products at a higher standard, you set a new<br />
benchmark, and that leads to additional business,” says Redder. In<br />
light of this, there’s no doubt that Spectrum Aeromed will continue<br />
to follow this trend in the near future.<br />
www.spectrum-aeromed.com<br />
34 | ASIAN SKY QUARTERLY — FIRST QUARTER <strong>2022</strong>
Connecting The World<br />
to Your Dream<br />
Dedicated to Service Excellence<br />
Striving for excellence with over 10 years business aviation<br />
management services in Asia Pacific<br />
Commitment on Asset Management<br />
Providing a full life cycle management service for business jet owners,<br />
offering a seamless and safe travel experience<br />
Personal Bespoke Services<br />
Creating memorable and delightful In-flight<br />
experiences for our passengers<br />
Take your business travel to the next level.<br />
www.sinojet.org<br />
Aircraft Delivery | Business Jet Management | Air Charter | Maintenance | FBO | Premium Travel Services | Ground Handling<br />
Beijing • Hong Kong • Shanghai • Hangzhou • Guangzhou • Shenzhen • Chengdu • Xiamen • Zhuhai • Macau • Singapore
SPONSORED CONTENT<br />
AN INTERVIEW WITH SINO JET<br />
STRIVING FOR<br />
SAFE AND SUSTAINABLE<br />
FLIGHT OPERATIONS<br />
West Chun, Vice President of Operations of<br />
Sino Jet Management Limited (Hong Kong)<br />
Mr. Chun<br />
Vice President of Operations, Sino Jet<br />
www.sinojet.org<br />
Mr. Chun joined Sino Jet in 2012, and is the Vice President of Operations of Sino Jet Hong Kong. He<br />
is responsible for leading Sino Jet Hong Kong’s Flight Operation Centre, fostering and reforming fleet<br />
management strategies, supervising all operations resources and flight planning management, as well as<br />
being responsible for crew training and license applications.<br />
He graduated from the University of Strathclyde in the UK, as well as from the French National School<br />
of Civil Aviation. He holds a Dispatcher License from United States Federal Aviation Administration,<br />
has professional qualifications in aviation safety management systems and risk assessment, and flight<br />
crew duty time management. Before joining Sino Jet, Mr. Chun was responsible for the daily operational<br />
management of commercial airlines, and for many years worked as a supervisor for a major European private<br />
aviation company based in Asia. He is also experienced in different aviation fields including passenger<br />
services, air cargo, and airport operations.<br />
Mr. Chun supports educating young people on careers in business and general aviation. He has been<br />
teaching and speaking in various tertiary colleges, institutions, and events to train up more professionals in<br />
the industry and nurture the industry’s future talent stream.<br />
1. In 2018, Sino Jet obtained the IS-BAO<br />
Stage 3 certification - the highest level of<br />
safety recognition in business aviation<br />
internationally and subsequently passed<br />
the renewal again in 2021. How does Sino<br />
Jet continue to maintain the highest safety<br />
standards?<br />
Safety remains the corporate<br />
culture of Sino Jet, and Sino<br />
Jet’s pursuit of continuous<br />
improvement in safety is<br />
practiced in all aspects of<br />
the company’s operations”<br />
36 | ASIAN SKY QUARTERLY — FIRST QUARTER <strong>2022</strong>
SPONSORED CONTENT<br />
Operational capability - Sino Jet holds China, the United States,<br />
Europe, Bermuda, Cayman Islands, Aruba Islands, Isle of Man,<br />
Guernsey, San Marino and other aircraft operational management<br />
and maintenance engineering qualifications; and, global operational<br />
management and maintenance qualification licenses. Among<br />
business jet companies in China, Sino Jet holds the largest number<br />
of operation and maintenance licenses, operates a fleet with the<br />
widest range of aircraft registrations, which lays a solid foundation<br />
for the safe operation of the company.<br />
With reliable information feeds, coupled with reasonable<br />
adjustments to the flight plan, the safety of flight operations can be<br />
secured. Sino Jet’s aircraft positioning system has the capability<br />
to accurately reflect 4D information about the tracked aircraft - the<br />
aircraft status can be accurately monitored and displayed on the<br />
system at any time and any place (3D: longitude, latitude, altitude).<br />
2. Could business jet management affect<br />
the monetary value of a business jet?<br />
Integrated information management - Complex matters can be<br />
better managed by standardisation and systematic management.<br />
This is what Sino Jet specialises in and attributes its safe<br />
operation to advanced scientific and technological information<br />
technology. Sino Jet affiliates an established software system<br />
development company, which excels in building advanced,<br />
comprehensive and mature information management systems<br />
in the business jet industry, developed products include aircraft<br />
operation systems, maintenance engineering management<br />
systems, safety management systems, flight quality monitoring<br />
systems and other aircraft process management systems. Each of<br />
these systems features a high degree of interconnectivity, through<br />
information integration, every link and every detail of each aircraft<br />
in its whole life cycle is efficiently documented, to uphold the<br />
quality of its safe operation and high level of traceability of the<br />
entire management process.<br />
Introduced a professional weather monitoring system and aircraft<br />
positioning system – Sino Jet understands weather plays a key<br />
role in aviation safety. To be able to accurately grasp weather<br />
information and be able to access real-time operational information<br />
about the aircraft, to make flights even safer. The global satellite<br />
positioning system can precisely calculate aircraft positions by<br />
using multilateration, which uses regular transmission data from<br />
satellites, and the professional weather monitoring system to<br />
supply weather trends in global flight regions and airports.<br />
As an industry benchmark, Sino Jet often emphasises the<br />
important concept of financial asset management in providing<br />
business jet management services to preserve the valuable asset<br />
of its clients.<br />
Full life cycle management: From management proposal, purchase<br />
inspection, aircraft delivery, daily operations, maintenance<br />
troubleshooting, aircraft inspections, asset disposal, etc., Sino<br />
Jet provides a full life cycle management service for business<br />
jet owners, accurately assessing customer needs and accurately<br />
evaluating aircraft conditions, to tailor suitable operation plans so<br />
that customers can enjoy the maximum level of protection in safety<br />
and security when they travel, whilst upholding the maximum value<br />
of their aircraft assets.<br />
Ensuring asset value preservation: In the aircraft trading market,<br />
the aircraft fuselage, maintenance, related equipment and archival<br />
information could directly affect the valuation of an aircraft. This<br />
is why it is important, that from receiving the aircraft, Sino Jet<br />
ensures compliance, integrity and traceability at every step of<br />
the management process in terms of safety, applicability, value<br />
preservation, economy and other aspects.<br />
Sino Jet maintains close contact with aircraft manufacturers and<br />
other operators, repeatedly crosschecks and exchanges aircraft<br />
information, ensures that maintenance records, maintenance<br />
FIRST QUARTER <strong>2022</strong> — ASIAN SKY QUARTERLY | 37
SPONSORED CONTENT<br />
guidance requirements, flight records, and technical records<br />
are up-to-date and complete. So that when an aircraft comes to<br />
transfer of ownership or change of registration, it remains in good<br />
condition and the process can be completed professionally in a<br />
wholesome approach; or when it finally comes to asset disposal,<br />
the transaction will be completed in an efficient manner at the most<br />
reasonable price.<br />
3. In the process of flight operations, how<br />
does the Sino Jet Flight Operations Centre<br />
safeguard the safe travel of its clients?<br />
Sino Jet Flight Operations Centre operates 24 hours a day with<br />
safety in mind, to exercise prudence and focus on providing<br />
operational support for every flight with its every strength.<br />
When we formulate flight plans. We make use of our aircraft<br />
dispatch and crew management systems, Jeppesen and NAVBLUE<br />
professional flight plan system, etc., that meet the requirements of<br />
the Civil Aviation Administration of China and the Federal Aviation<br />
Administration; in addition to the most advanced communication<br />
equipment and maintaining close contact with meteorological and<br />
civil aviation units from various countries.<br />
Sino Jet has operating bases and offices in 20 cities internationally<br />
and takes advantage of utilising available resources within its<br />
network to service its domestic and international flights. Our<br />
international team works tirelessly to coordinate with our partners<br />
to support our fleet operations, aircraft scheduling and crew<br />
operations, and ensure that all operations are performed safely,<br />
legally and flexibly under applicable regulations.<br />
Our team members are very well experienced in business aviation<br />
and adheres strictly to all applicable safety procedures; additionally,<br />
they receive regular training in flight scheduling and dispatch,<br />
aviation safety, business jet operations, etc to ensure their skills are<br />
up to date. Prior to each flight, the aircraft status is<br />
comprehensively assessed, the departure, destination and diversion<br />
airports are all planned in detail and monitored, as are other<br />
aspects, including weather conditions, airspace restrictions, crew<br />
duty and rest time to ensure operational safety.<br />
Furthermore, we have established a global network of operations<br />
and auxiliary resources. We have our own affiliated aviation ground<br />
handling agency, Fareast Aviation Service Co., that works closely<br />
with local FBOs and local agents. When we select our local ground<br />
handling partners, in addition to their international standard<br />
certifications such as IS-BAH, we conduct annual evaluations in<br />
each region to analyse the service standards and the availability<br />
and accessibility of airport resources, so that we can consistently<br />
uphold and improve our operational efficiency and service quality,<br />
and ultimately safeguard our every safe and smooth flight.<br />
4. Amid the challenging pandemic situation<br />
in Hong Kong, how does the Flight<br />
Operations Centre of Sino Jet Hong Kong<br />
maintain its operational advantage?<br />
Sino Jet has increased its investments in strengthening its<br />
internet and remote working capabilities, making the best use of<br />
the latest technology. Sino Jet has also adopted flexible working<br />
arrangements, formulated clear performance indicators, policies and<br />
procedures, and setup remote office systems all to help its team of<br />
professionals continue working efficiently in any safe environment.<br />
Sino Jet Hong Kong has also setup a backup operations control<br />
centre. The whole team of staff are sent to work in different shifts<br />
and locations to reduce exposure of every staff on duty. This mixedwork<br />
mode and remote work arrangement have matured over time,<br />
Sino Jet has proven to remain highly responsive to any abrupt<br />
changes in aircraft plans or requests and last-minute cancellations.<br />
38 | ASIAN SKY QUARTERLY — FIRST QUARTER <strong>2022</strong>
SPONSORED CONTENT<br />
Sino Jet has many domestic and foreign service resources. During<br />
the epidemic, some of our clients have opted to travel to several<br />
uncharted destinations, and we have always managed to efficiently<br />
arrange a trusted reception staff locally to provide a seamless and<br />
quality travel experience.<br />
5. Green Aviation appears to be the future,<br />
how is Sino Jet preparing for this?<br />
Sino Jet actively answered the call for a Green Aviation strategy. Over<br />
the past few years, we have adopted several measures to reduce<br />
greenhouse gas emissions, such as the launch of energy conservation<br />
and emission reduction initiatives to our employees, establishing a<br />
paperless office, and the use of electronic flight bags (EFBs).<br />
Recently, have imported our own Dassault Falcon 7X business jet<br />
from France, and we successfully achieved a “carbon neutral” flight<br />
in the delivery process by taking low-carbon emission reduction<br />
measures and offsetting China Certified Emission Reductions.<br />
It was the first “Carbon Neutral” flight in the history of business<br />
aviation in China.<br />
Looking ahead, Sino Jet will continue its commitment with<br />
its advocated business jet information management method,<br />
working closely with its carbon management consultant to<br />
formulate a “carbon management” system to achieve better<br />
energy conservation and emission reduction scientifically, through<br />
standardisation, and quantifiable and traceable methods. Sino Jet<br />
will soon be launching “carbon neutral” flight services, bringing<br />
the “green flight” option to the consumers and the industry. As a<br />
fulfilment of its corporate social responsibility, Sino Jet wishes to<br />
continue to lead more business jet users and partners to accelerate<br />
their pace of carbon neutrality.<br />
FIRST QUARTER <strong>2022</strong> — ASIAN SKY QUARTERLY | 39
SPONSORED CONTENT<br />
BIG NEW JETS<br />
FROM DASSAULT<br />
ON THE HORIZON<br />
Falcon 6X Certification Nears,<br />
with Construction of<br />
First Falcon 10X Close Behind<br />
Dassault very much has <strong>Asian</strong> customers in its mind for its new business jets. The French manufacturer,<br />
which also builds the Rafale fighter, is focusing on large, comfortable cabins in aircraft that can fly long<br />
distances, which are the top criteria for customers in China and elsewhere.<br />
The company also wants its customers to know that comfort<br />
and capability come with technologies derived from the fighter<br />
jet side of the business. These include advanced fly-by-wire<br />
systems; all-seeing enhanced vision systems for operation in any<br />
weather; and military grade safeguards such as fuel tank inerting<br />
to prevent sparks.<br />
It’s a unique approach aimed at delivering rugged, reliable aircraft<br />
that still feel like flying penthouses.<br />
The 5,500 nm (10,200 km) Falcon 6X exemplifies this philosophy.<br />
The 6X was designed for long-range comfort with the tallest<br />
and widest cabin its class, six feet six inches tall (1.98 meters)<br />
by eight feet six inches wide (2.58 meters). In fact, until the<br />
introduction of the larger 10X, it will have the widest cross-section<br />
of any business jet, allowing customers to create unique cabin<br />
arrangements that provide exceptional comfort whilst crossing<br />
many time zones.<br />
The flight test program for the 6X is on schedule, and<br />
certification is due before the end of the year. As of this<br />
writing, one test aircraft is in Iqaluit, Canada in the Arctic Circle<br />
40 | ASIAN SKY QUARTERLY — FIRST QUARTER <strong>2022</strong>
SPONSORED CONTENT<br />
undergoing “cold soak” testing, seeking temperatures down to<br />
-40°C. The 17-person test team reports being really cold, but very<br />
satisfied with the aircraft’s performance.<br />
Test pilots have flown five examples of the aircraft for more than<br />
600 hours, expanding the flight envelope from the slowest speeds<br />
(the aircraft can land as slowly as 109 knots) to the fastest.<br />
They’ve performed stalls in all sorts of weight and balance<br />
combinations, landed with high crosswinds and tailwinds, mapped<br />
a completed cabin for sound and for temperature variations, and<br />
performed hundreds of other tests.<br />
Their consensus is that the 6X has delightful flight<br />
characteristics, even in comparison with other Falcon models, a<br />
line known for precise handling. The 6X has the most advanced<br />
fly-by-wire system in a Falcon to date, which helps explain the<br />
pilot accolades. Previous fly-by-wire versions controlled ailerons,<br />
elevators and the rudder. The 6X controls all moving surfaces,<br />
including a new control device known as a flaperon, which aids in<br />
the steep approaches required at some airports.<br />
Last December, the aircraft operated for a week from Dassault’s<br />
Paris-Le Bourget FBO, where it was fueled with a sustainable<br />
aviation fuel (SAF) blend from TotalEnergies. The 6X can be<br />
operated on up to 50 percent SAF. Sustainability has become<br />
a major objective for many of Dassault’s customers’ flight<br />
departments.<br />
Meanwhile, detailed design is nearly complete for the 10X,<br />
indisputably the largest and most advanced purpose built business<br />
jet. The 10X has been designed to compete at the very top of the<br />
business jet market, with a range of 7,500 nautical miles (13,900<br />
km) and a maximum speed of Mach .925. The cabin dimensions<br />
create new possibilities for highly customized environments where<br />
passengers can be at home on trips up to 15 hours.<br />
For example, aft staterooms of various lengths can be designed<br />
and can be equipped with a true queen-size bed, something that<br />
is not feasible in other ultra-long-range jets. Cabin dividers can<br />
be spaced according to owner preference, creating an extra-large<br />
dining area, for example, or a small, intimate TV room with a popup<br />
large screen opposite a divan.<br />
The 10X cabin is eight inches wider than the next largest cabin,<br />
which happens to be the 6X and height is six feet, eight inches (2.03<br />
meters), the tallest in the industry. Cabin volume is approximately<br />
15 percent greater than ultra-long-range competitors.<br />
FIRST QUARTER <strong>2022</strong> — ASIAN SKY QUARTERLY | 41
SPONSORED CONTENT<br />
As big as it is, the 10X will continue the Falcon tradition of<br />
providing access to smaller reliever airports and will also<br />
have steep approach capabilities for challenging fields<br />
such as London City Airport. Takeoff distance is less than<br />
6,000 feet and landing distance is less than 2,500 feet.”<br />
42 | ASIAN SKY QUARTERLY — FIRST QUARTER <strong>2022</strong>
SPONSORED CONTENT<br />
The 10X adds even more capability to the digital flight control<br />
system. Though it has two engines, it has one Smart Throttle<br />
to control them, simplifying power management. The Smart<br />
Throttle is linked to a groundbreaking automatic recovery mode<br />
that protects against a wake turbulence encounter or other upset<br />
scenario. This system was pioneered on the Rafale fighter.<br />
The 10X will be powered by 18,000-pound thrust Rolls Royce Pearl<br />
10X engines, the most recent and powerful in the ultra-efficient<br />
Pearl family. The 10X will break new ground in being 100-percent<br />
SAF capable.<br />
The first parts for the 10X will be manufactured in <strong>2022</strong>. Dassault<br />
expects entry into service for its new flagship in 2025.<br />
www.dassaultfalcon.com
The artistry ¹<br />
behind the<br />
art of flight<br />
1<br />
Artistry - a dedication to the details that shape flight in its smoothest form.<br />
Aircraft Management, Charter, Completions, FBO, Maintenance, Staffing.<br />
JetAviation.com
GLOBAL<br />
PRE-OWNED<br />
MARKET UPDATE<br />
“With preowned inventory so low and resale retail transactions continuing to outperform, good aircraft are selling quickly, and buyers<br />
have no choice but to pay a premium if they want to win the desired aircraft.”<br />
“As to the whether the momentum of 2021 continues throughout <strong>2022</strong>, the sad and tragic events in Ukraine are the wild card as it<br />
remains to see how things fully play out. Assuming we don’t see a broader European conflict, we would anticipate seeing robust<br />
demand and higher values continuing through the end of <strong>2022</strong>.”<br />
—Andrew Young, AMSTAT General Manager<br />
FIRST QUARTER <strong>2022</strong> — ASIAN SKY QUARTERLY | 45
GLOBAL PRE-OWNED MARKET UPDATE<br />
BUSINESS JETS & TURBOPROPS FOR SALE / LEASE<br />
Jets<br />
Turboprop<br />
1,800<br />
1,500<br />
1,200<br />
900<br />
600<br />
Despite record low preowned<br />
inventory, used business<br />
aircraft transactions continue<br />
to perform well as increasing<br />
values entice existing<br />
operators to sell.<br />
300<br />
Mar<br />
Apr<br />
May<br />
Jun<br />
Jul<br />
Aug<br />
Sep<br />
Oct<br />
Nov<br />
Dec<br />
Jan<br />
<strong>2022</strong><br />
Feb<br />
Mar<br />
BUSINESS JETS - RESALE RETAIL TRANSACTIONS<br />
600<br />
2020 2021 <strong>2022</strong><br />
500<br />
400<br />
300<br />
200<br />
100<br />
0<br />
Jan Prelim<br />
Feb Prelim<br />
Mar<br />
Apr<br />
May<br />
Jun<br />
Jul<br />
Aug<br />
Sep<br />
Oct<br />
Nov<br />
Dec<br />
BUSINESS TURBOPROPS - RESALE RETAIL TRANSACTIONS<br />
2020 2021 <strong>2022</strong><br />
250<br />
200<br />
150<br />
100<br />
50<br />
0<br />
Jan Prelim<br />
Feb Prelim<br />
Mar<br />
Apr<br />
May<br />
Jun<br />
Jul<br />
Aug<br />
Sep<br />
Oct<br />
Nov<br />
Dec<br />
46 | ASIAN SKY QUARTERLY — FIRST QUARTER <strong>2022</strong>
GLOBAL PRE-OWNED MARKET UPDATE<br />
HEAVY JETS - SHORT TERM MEDIAN VALUE CHANGE<br />
30%<br />
Increase Decrease Total<br />
20%<br />
10%<br />
0%<br />
-10%<br />
-20%<br />
-30%<br />
Over the past 12 months the median value of Heavy Jets has risen<br />
34%. This metric is now up 28% since the start of 2020 and up<br />
9% year-to-date. The overall positive direction of values has been<br />
driven by demand with a 28% increase in resale retail transactions<br />
40%<br />
30%<br />
-20%<br />
-30%<br />
Jan1 Jan1<br />
Feb1 Feb1<br />
Feb15 Feb15<br />
Mar15 Mar15<br />
Apr1 Apr1<br />
Apr15 Apr15<br />
May1 May1<br />
May15 May15<br />
Jun1 Jun1<br />
Jun15 Jun15<br />
Jul1 Jul1<br />
Jul15 Jul15<br />
Aug1 Aug1<br />
Aug15 Aug15<br />
Sep1 Sep1<br />
Sep15 Sep15<br />
SUPER-MID JETS - SHORT TERM MEDIAN VALUE CHANGE<br />
20%<br />
10%<br />
0%<br />
-10%<br />
Increase Decrease Total<br />
Oct1 Oct1<br />
Oct15 Oct15<br />
Nov1 Nov1<br />
Nov15 Nov15<br />
Dec1 Dec1<br />
Dec15 Dec15<br />
Jan1 Jan1<br />
Jan15 Jan15<br />
Feb1 Feb1<br />
Feb15 Feb15<br />
Mar1 Mar1<br />
Mar15 Mar15<br />
Apr1 Apr1<br />
Apr15 Apr15<br />
May1 May1<br />
May15 May15<br />
Jun1 Jun1<br />
Jun15 Jun15<br />
Jul1 Jul1<br />
Jul15 Jul15<br />
Aug1 Aug1<br />
Aug15 Aug15<br />
in 2021 over 2020 and a 39% increase ahead of 2019. At the same<br />
time the availability of preowned Heavy Jets has shrunk 56%<br />
year-over-year further adding upward pressure on what buyers are<br />
having to pay.<br />
Sep1 Sep1<br />
Sep15 Sep15<br />
Oct1 Oct1<br />
Oct15 Oct15<br />
Nov15 Nov15<br />
Nov1 Nov1<br />
Dec1 Dec1<br />
Dec15 Dec15<br />
Jan1 Jan1<br />
Jan15 Jan15<br />
Feb1 Feb1<br />
Feb15 Feb15<br />
Since March 2021, the median value of Super-Mid Jets has risen<br />
up to 44%. This same metric is up 35% since the start of 2020 and<br />
up 9% year-to-date. The positive direction of values is in large part<br />
due to the continued momentum in resale transactions, with 2021<br />
activity up 29% over 2020 and up 66% over 2019, with a 65% drop in<br />
Super-Mid Jet resale inventory.<br />
FIRST QUARTER <strong>2022</strong> — ASIAN SKY QUARTERLY | 47
GLOBAL PRE-OWNED MARKET UPDATE<br />
MEDIUM JETS - SHORT TERM MEDIAN VALUE CHANGE<br />
40%<br />
Increase Decrease Total<br />
30%<br />
20%<br />
10%<br />
0%<br />
-10%<br />
-20%<br />
-30%<br />
Jan1<br />
Feb1<br />
Feb15<br />
Mar15<br />
Apr1<br />
Apr15<br />
May1<br />
May15<br />
Jun1<br />
Jun15<br />
Jul1<br />
Jul15<br />
Aug1<br />
Aug15<br />
Sep1<br />
Sep15<br />
Oct1<br />
Oct15<br />
Nov1<br />
Nov15<br />
Dec1<br />
Dec15<br />
Jan1<br />
Jan15<br />
Feb1<br />
Feb15<br />
Mar1<br />
Mar15<br />
Apr1<br />
Apr15<br />
May1<br />
May15<br />
Jun1<br />
Jun15<br />
Jul1<br />
Jul15<br />
Aug1<br />
Aug15<br />
Sep1<br />
Sep15<br />
Oct1<br />
Oct15<br />
Nov1<br />
Nov15<br />
Dec1<br />
Dec15<br />
Jan1<br />
Jan15<br />
Feb1<br />
Feb15<br />
The median value of Medium Jets has risen to 52% over the last<br />
year. This metric is now up 34% since the start of 2020 and is up<br />
18% year-to-date. As with other jet segments this upward trend<br />
continues to be driven by high demand and low supply. Medium<br />
Jet resale retail transaction activities in 2021 was up 19%<br />
over 2020 and up 40% over 2019. The availability of preowned<br />
Medium Jets is down 56% year-over-year.<br />
LIGHT JETS - SHORT TERM MEDIAN VALUE CHANGE<br />
30%<br />
Increase Decrease Total<br />
20%<br />
10%<br />
0%<br />
-10%<br />
-20%<br />
-30%<br />
Jan1<br />
Feb1<br />
Feb15<br />
Mar15<br />
Apr1<br />
Apr15<br />
May1<br />
May15<br />
Jun1<br />
Jun15<br />
Jul1<br />
Jul15<br />
Aug1<br />
Aug15<br />
Sep1<br />
Sep15<br />
Oct1<br />
Oct15<br />
Nov1<br />
Nov15<br />
Dec1<br />
Dec15<br />
Jan1<br />
Jan15<br />
Feb1<br />
Feb15<br />
Mar1<br />
Mar15<br />
Apr1<br />
Apr15<br />
May1<br />
May15<br />
Jun1<br />
Jun15<br />
Jul1<br />
Jul15<br />
Aug1<br />
Aug15<br />
Sep1<br />
Sep15<br />
Oct1<br />
Oct15<br />
Nov1<br />
Nov15<br />
Dec1<br />
Dec15<br />
Jan1<br />
Jan15<br />
Feb1<br />
Feb15<br />
Over the past 12 months, the median value of Light Jets has risen<br />
37%. This metric is now up 18% since the start of 2020 and is up<br />
6% year-to-date. The positive direction of Light Jet values is in large<br />
part due to the continued buoyancy in resale retail transactions<br />
with 2021 up 28% over 2020 and up 49% over 2019. This demand<br />
combined with a 50% drop in Light Jet resale inventory year-overyear<br />
has continued to drive values upwards.<br />
48 | ASIAN SKY QUARTERLY — FIRST QUARTER <strong>2022</strong>
GLOBAL PRE-OWNED MARKET UPDATE<br />
TURBOPROPS - SHORT TERM MEDIAN VALUE CHANGE<br />
30%<br />
Increase Decrease Total<br />
20%<br />
10%<br />
0%<br />
-10%<br />
-20%<br />
-30%<br />
Jan1<br />
Feb1<br />
Feb15<br />
Mar15<br />
Apr1<br />
Apr15<br />
May1<br />
May15<br />
Jun1<br />
Jun15<br />
Jul1<br />
Jul15<br />
Aug1<br />
Aug15<br />
Sep1<br />
Sep15<br />
Oct1<br />
Oct15<br />
Nov1<br />
Nov15<br />
Dec1<br />
Dec15<br />
Jan1<br />
Jan15<br />
Feb1<br />
Feb15<br />
Mar1<br />
Mar15<br />
Apr1<br />
Apr15<br />
May1<br />
May15<br />
Jun1<br />
Jun15<br />
Jul1<br />
Jul15<br />
Aug1<br />
Aug15<br />
Sep1<br />
Sep15<br />
Oct1<br />
Oct15<br />
Nov1<br />
Nov15<br />
Dec1<br />
Dec15<br />
Jan1<br />
Jan15<br />
Feb1<br />
Feb15<br />
The median value of Turboprops has risen 33% over the last 12<br />
months. This metric is now up 27% since the start of 2020 but has<br />
remained largely unchanged year-to-date. There is no evidence<br />
that this recent plateau in values is due to a slowing of transaction<br />
activity with Turboprop resale transaction activity in 2021 up 25%<br />
over 2020 and up 32% over 2019. As with the other markets here,<br />
options for buyers are fewer in the preowned Turboprop market<br />
with a 45% drop in available units year-over-year.<br />
* IMPORTANT NOTE: This chart represents aggregated data. The changes in values this year within individual make and model markets, and for specific serial numbers, may vary to a<br />
greater or lesser degree from these trends.<br />
FIRST QUARTER <strong>2022</strong> — ASIAN SKY QUARTERLY | 49
Aircraft Shopper Online<br />
The Aircraft Market in Real Time<br />
®<br />
Find Premium Aircraft For Sale<br />
Visit us at<br />
WWW.ASO.COM<br />
SELLING?<br />
Use our easy-to-use aircraft ad building tools<br />
or let us create the ad for you.<br />
Contact us for more information<br />
(US) +1-732-704-9561 | WWW.ASO.COM | SERVICE@ASO.COM<br />
©<strong>2022</strong> Aircraft Shopper Online, ASO, The ASO Logo, and The Aircraft<br />
Market in Real Time are registered United States Trademarks<br />
Airc
GLOBAL<br />
BUSINESS<br />
AVIATION<br />
MARKET<br />
UPDATE<br />
By Global Jet Capital<br />
Business aviation flight and transaction activity was strong, the<br />
major OEMs reported improving results following COVID-19 related<br />
disruptions, and the pricing of pre-owned aircraft improved as inventory<br />
declined. With new users continuing to enter the market, economic<br />
growth is expected to maintain a positive trajectory, and general<br />
business activity expected to increase, the business jet market should<br />
maintain its current positive posture into <strong>2022</strong>. Growth in Europe<br />
and Asia will further drive the market as border restrictions ease and<br />
international travel gradually resumes.<br />
• Despite concerns related to supply chain disruptions, continued<br />
COVID-19 outbreaks, and inflation, the global economy grew at a<br />
strong pace.<br />
• Driven by entry of new customers into the market, business jet flight<br />
operations increased substantially compared to the same period in<br />
2020, and 22 percent compared to 2019.<br />
• OEMs reported another strong quarter for their order books, driving<br />
up backlogs.<br />
• With a 29 percent increase in 2021 compared to 2020, the value of<br />
pre-owned transactions drove the overall business jet transaction<br />
market, which grew 14 percent compared to the same period in 2020.<br />
• Inventory levels continued to decline and remained at historic lows.<br />
• Limited supply and continued demand have given business jet<br />
sellers additional bargaining power, resulting in broad-based strength<br />
in bluebook values.<br />
raft Shopper Online<br />
The Aircraft Market in Real Time<br />
®<br />
FIRST QUARTER <strong>2022</strong> — ASIAN SKY QUARTERLY | 51
GLOBAL BUSINESS AVIATION MARKET UPDATE<br />
GLOBAL ECONOMY<br />
15%<br />
Global GDP YoY Percent Change<br />
10%<br />
5%<br />
0%<br />
- 5%<br />
- 10%<br />
<strong>Q1</strong> 2020 Q2 2020 Q3 2020 Q4 2020 <strong>Q1</strong> 2021 Q2 2021 Q3 2021 Q4 2021 <strong>Q1</strong> <strong>2022</strong> Q2 <strong>2022</strong> Q3 <strong>2022</strong> Q4 <strong>2022</strong><br />
(Forecast) (Forecast) (Forecast) (Forecast)<br />
i<br />
With GDP increasing 4.2 percent, the global economy experienced<br />
strong growth in Q4 2021, capping a strong 2021. Economists<br />
credit decisive government action and declining COVID-19 infection<br />
rates for the strong economic performance in 2021. Still, threats<br />
remain for future growth including continued COVID-19 outbreaks<br />
(driven by virus mutations), supply chain disruptions, and inflation.<br />
While COVID-19 continues to threaten economic growth, the<br />
global vaccine campaign continued to make progress with over<br />
9.9 billion vaccinations administered globally by mid-January<br />
<strong>2022</strong> ii . Furthermore, supply chain disruptions began to moderate<br />
by the end of 2021, with further improvements expected through<br />
<strong>2022</strong>. As supply chains improve, manufacturers will meet demand<br />
from consumers, easing pressure on inflation. Central banks are<br />
also expected to increase interest rates in <strong>2022</strong>, further slowing<br />
inflation. With all of these factors taken into account, the economic<br />
outlook for <strong>2022</strong> remains strong, despite threats. iii<br />
FLIGHT OPERATIONS<br />
Global Business Jet Flights<br />
U.S.<br />
Rest of World<br />
761,373<br />
29.5%<br />
70.5%<br />
641,903<br />
29.5%<br />
70.5%<br />
357,623<br />
27.0%<br />
73.0%<br />
647,770 641,494 659,442<br />
33.6% 28.1% 26.3%<br />
66.4% 71.9% 73.7%<br />
937,124 928,617<br />
825,347<br />
32.4% 28.3%<br />
28.1%<br />
71.9% 67.6% 71.7%<br />
Q4 2019 <strong>Q1</strong> 2020 Q2 2020 Q3 2020 Q4 2020 <strong>Q1</strong> 2021 Q2 2021 Q3 2021 Q4 2021<br />
iv<br />
Business jet flight operations have recovered from pandemic<br />
lows and have now surpassed 2019 levels. In 2021, global flight<br />
operations were 8.8 percent above levels seen in 2019. Although<br />
flights declined sequentially in Q4 2021, they were 22 percent<br />
higher than Q4 2019 – the last full quarter before COVID-19 became<br />
widespread globally. With more than 3.3 million flights globally in<br />
2021, business jet operators flew more sectors than in any previous<br />
year on record. v<br />
This increase in demand, driven by the entry of new customers into<br />
the market, has benefited business jet operators and manufacturers<br />
alike. vi One study found that flying privately can reduce almost 700<br />
“person-to-person” touchpoints compared to a commercial flight, a<br />
major selling point for the industry. vii<br />
Although many people began using business aviation to avoid<br />
potentially crowded airports, a substantial number are expected to<br />
continue to utilize business aviation as they become accustomed<br />
to the safety, comfort, convenience, and productivity that come with<br />
flying aboard a business aircraft. In a recent survey of business<br />
jet users, 97 percent of all respondents indicated that they would<br />
use business aviation as much as or more than they did prior to<br />
COVID-19. Of the respondents who started using business aviation<br />
during the COVID-19 pandemic, nearly all said they would use<br />
business aviation at least some of the time after the pandemic<br />
is over, with 53 percent saying they would use it regularly. viii The<br />
business aviation market will further benefit as large corporate<br />
business travel returns, driving continued growth in business jet<br />
flight operations.<br />
52 | ASIAN SKY QUARTERLY — FIRST QUARTER <strong>2022</strong>
GLOBAL BUSINESS AVIATION MARKET UPDATE<br />
OEM BACKLOGS<br />
Q4 Backlog at Major Business Jet OEMs<br />
USD Millions<br />
$29,282<br />
Bombardier Gulfstream Cessna<br />
$32,178<br />
$23,611<br />
Dassault and Embraer have not reported as of publication<br />
Q4 2019 Q4 2020 Q4 2021<br />
ix<br />
Strong demand for business jets drove robust orders for new<br />
aircraft in Q4. With orders surpassing revenue, the industry-wide<br />
book-to-bill ratio was 1.3-to-1 and backlogs increased to $32.2<br />
billion – a 36.3 percent increase from a year earlier. The rising<br />
backlogs have increased lead times for new aircraft, improving<br />
flexibility and manufacturing efficiency for many OEMs. Orders<br />
for new aircraft are being driven by new users to the business jet<br />
market, habitual pre-owned buyers ordering new aircraft due to low<br />
pre-owned inventory, typical replacement and trade up patterns, and<br />
fleet operators who are experiencing demand for their services.<br />
TRANSACTIONS ($ VOLUME)<br />
Business Jet Transactions, 2019-2021<br />
New<br />
$28.2B<br />
(3,129 Units) $26.0B<br />
(3,143 Units)<br />
$11.4B<br />
-7.7%<br />
(2,334 Units) $11.9B<br />
(2,537 Units)<br />
Pre-Owned<br />
13.8%<br />
$29.6B<br />
(3,624 Units)<br />
$15.3B<br />
(2,997 Units)<br />
-4.5%<br />
29.2%<br />
$16.9B<br />
(795 Units)<br />
-15.9%<br />
$14.2B<br />
(606 Units)<br />
0.9%<br />
$14.3B<br />
(627 Units)<br />
2019 2020 2021<br />
x<br />
Note that 2021 figures are based on preliminary data and may increase as more transactions are reported.<br />
In 2021, new and pre-owned transaction dollar volume increased<br />
13.8 percent compared to 2020 and increased 5 percent compared<br />
to 2019. The recovery in business jet transactions is being led by<br />
the pre-owned market, which increased 29.2 percent in 2021 from a<br />
year earlier and 34.2 percent from 2019.<br />
The number of pre-owned transactions increased despite low<br />
inventory (which can reduce selection for buyers), demonstrating<br />
both strong demand and buyers’ resourcefulness in finding aircraft<br />
when relatively few options exist on the market. Strong demand<br />
drove the number of 2021 pre-owned transactions to the highest<br />
level on record. It remains to be seen if transactions can continue<br />
at these high levels with continued diminishing inventory levels.<br />
During the early stages of the pandemic, many manufacturers<br />
reduced production due to supply chain issues and anticipated<br />
reductions in demand. In response to strong order activity,<br />
deliveries in 2021 were 0.9 percent higher than in 2020. However,<br />
production remained about 15 percent below 2019 levels as<br />
manufacturers gradually increased production rates. Some<br />
manufacturers expect to return to 2019 production levels in <strong>2022</strong>.<br />
FIRST QUARTER <strong>2022</strong> — ASIAN SKY QUARTERLY | 53
GLOBAL BUSINESS AVIATION MARKET UPDATE<br />
FOR SALE INVENTORY<br />
Aircraft Listed for Sale<br />
2,206<br />
1,843<br />
2020 2021<br />
xi<br />
The number of aircraft listed for sale started to decline in late 2020<br />
as owners held onto their business jets during COVID-19. That trend<br />
continued throughout 2021, with listings 16.5 percent lower than<br />
in 2020. In 2020, the average number of aircraft listed for sale per<br />
week was 45 and that declined to 35.4 in 2021. There is growing<br />
evidence that many pre-owned aircraft are being sold prior to being<br />
listed, meaning transactions can continue despite low listings and<br />
inventory. Listings may remain low until new deliveries begin to pick<br />
up, driving owners to market current aircraft once they take delivery<br />
of new aircraft.<br />
Percent of Business Jet Fleet for Sale<br />
Total<br />
0-12 Years<br />
13+ Years<br />
14.0%<br />
12.0%<br />
10.0%<br />
8.0%<br />
6.0%<br />
4.0%<br />
2.0%<br />
0.0%<br />
Q4 2019 <strong>Q1</strong> 2020 Q2 2020 Q3 2020 Q4 2020 <strong>Q1</strong> 2021 Q2 2021 Q3 2021 Q4 2021<br />
xii<br />
Strong pre-owned transactions and fewer aircraft listings led to<br />
declining business jet inventory in 2021. At the end of the year,<br />
inventory stood at 3.7 percent of the total fleet – lower than at<br />
any time during the last two years and representing an all-time<br />
low. Furthermore, inventory of aircraft younger than 13 years old<br />
(typically seen as more desirable) was only 1.9 percent of the<br />
global fleet.<br />
54 | ASIAN SKY QUARTERLY — FIRST QUARTER <strong>2022</strong>
GLOBAL BUSINESS AVIATION MARKET UPDATE<br />
RESIDUAL VALUE<br />
YoY % Change in Values<br />
13.1%<br />
1.3%<br />
1.2%<br />
-6.1%<br />
-6.5%<br />
-7.2%<br />
2012 2013 2014 2015<br />
2016<br />
2017 2018 2019<br />
2020<br />
-3.1%<br />
-0.3%<br />
-0.3%<br />
-5.2%<br />
2021<br />
xiii<br />
The above chart compares the year-over-year percentage change in<br />
the bluebook value of like-aged aircraft over time (e.g., the difference<br />
between the value of an eight-year-old aircraft from one year to the<br />
next). Global Jet Capital analyzes a basket of aircraft as a proxy for<br />
the overall market. Observed increases or decreases in value are not<br />
necessarily applicable to any specific aircraft make/model. For the<br />
value of a specific aircraft, please contact a licensed aircraft appraiser.<br />
Business jet bluebook values have increased since lockdowns and<br />
other COVID-19 measures began easing up. Overall values climbed<br />
13.1 percent on average compared to a year ago, with prices having<br />
appreciated even more in some cases. On a model-by-model basis,<br />
values varied, with some aircraft outperforming others in the market.<br />
With recent increases, like-aged aircraft values have recovered to<br />
near pre-COVID levels and have even exceeded them in some cases.<br />
On an absolute basis the current values have returned to, or even<br />
exceeded in some cases, pre-COVID forecasts based upon historical<br />
depreciation rates. As such, business aircraft values have performed<br />
better than they did during the 2008 financial crisis and the 2016<br />
decline in commodity values.<br />
Though the world remains in a fluid situation, users of business jets<br />
are enjoying the comfort, convenience, and productivity that these<br />
assets provide. As a result, owners held onto their aircraft while new<br />
buyers entered the market. Disciplined production rates by major<br />
OEMs have added to the sellers’ market. While prices can fluctuate<br />
model by model and deal by deal, reports have emerged of buyers<br />
offering high premiums to get quality aircraft. Whether the current<br />
situation continues beyond 2021 depends on both strong demand<br />
and low supply continuing.<br />
CONCLUSION<br />
The business jet industry demonstrated the strong market dynamics<br />
that have developed over the previous years – including production<br />
discipline and steady demand growth.<br />
The second half of 2020 saw the industry enter a period of strong<br />
growth and demand which continued throughout 2021. Led by the<br />
entrance of new users, business jet flights have increased compared<br />
to 2020 and 2019 levels. Pre-owned transactions continued at a high<br />
level and inventory declined to a new historic low, a further sign of<br />
robust demand. Orders for new aircraft have also remained healthy,<br />
with manufacturers reporting active order books and increasing<br />
backlogs. Strong demand and low inventories have led to broadbased<br />
price strength.<br />
Thanks to an improving economy, increasing business activity, and<br />
new users entering the market – who are expected to stay – demand<br />
for business aviation flights and business jets themselves are<br />
expected to remain strong in <strong>2022</strong>.<br />
Notes<br />
i<br />
Oxford Economics, ii Hannah Ritchie, Esteban Ortiz-Ospina, Diana Beltekian, Edouard Mathieu, Joe Hasell, Bobbie Macdonald, Charlie Giattino, Cameron Appel, Lucas Rodés-Guirao and<br />
Max Roser (2020) - “Coronavirus Pandemic (COVID-19)”. Published online at OurWorldInData.org. Retrieved from: https://ourworldindata.org/coronavirus [Online Resource], ii Oxford<br />
Economics, iv WingX and Global Jet Capital Analysis, v WingX and Global Jet Capital Analysis, vi Aviation International News, vii The Weekly of Business Aviation | Aviation Week Network,<br />
viii<br />
Private Jet Card Comparisons, ix Company financial reports. Dassault and Embraer have not reported as of publication time and are not included in this analysis. x JetNet and Global<br />
Jet Capital analysis. Units are in parentheses, xi Amstat and Global Jet Capital Analysis, xii JetNet and Global Jet Capital Analysis, xiii Aircraft Bluebook and Global Jet Capital analysis<br />
FIRST QUARTER <strong>2022</strong> — ASIAN SKY QUARTERLY | 55
\<br />
BUSINESS AVIATION SIMPLIFIED.<br />
THE KEY TO SIMPLIFYING YOUR NEXT<br />
TRANSACTION IS OUR EXPERIENCE.<br />
The goal of every business aviation transaction is the same—to get<br />
people from point A to point B as quickly and efficiently as possible.<br />
On the other hand, the needs of each business aviation client are unique. Which is why<br />
we focus on creating customized financial solutions designed to meet your unique<br />
requirements. From freeing up cash to meeting aggressive deadlines, our goal is simple:<br />
to provide the most straightforward process in the industry and make aircraft financing<br />
simpler. It’s what happens when you’re only focused on one thing.<br />
844.436.8200 \ info@globaljetcapital.com \ globaljetcapital.com<br />
LEASING & LENDING SOLUTIONS<br />
HONG KONG \ NEW YORK \ ZURICH
PRE-OWNED<br />
MARKET<br />
SPOTLIGHT<br />
CHALLENGER 300 & 350<br />
Market Analysis by Bowen Zhang<br />
FIRST QUARTER <strong>2022</strong> — ASIAN SKY QUARTERLY | 57
PRE-OWNED MARKET SPOTLIGHT: CHALLENGER 300 & 350<br />
HISTORY AND MODEL INTRODUCTION<br />
During the late 1990s there were arguably only three categories<br />
of business jets: Small, Mid-size and Large. However, over the<br />
past 20 years this has changed, as manufacturers looked to fill in<br />
the gaps in-between the categories. These we have Heavy, extralarge,<br />
corporate airliners, Ultra-long-range and the longer-than-<br />
Ultra-long-range categories introduced to the market.<br />
The Challenger 300 is powered by a pair of Honeywell HTF7000<br />
engines, which have high thrust power. This gives the aircraft a<br />
significant advantage with the distance that it needs to takeoff<br />
or land, which has been welcomed by many travelers (and their<br />
pilots) as the Challenger 300 can access airports with smaller<br />
runways.<br />
But when the Bombardier Continental, as the Challenger 300<br />
was originally known, was first introduced in 1999 it had a larger<br />
cabin than the existing Mid-size cabin aircraft, but with and<br />
airframe and weight that did not fit into the “Large” category. Not<br />
wanting to class it as a Mid-size, Bombardier decided to call the<br />
aircraft “Super Mid-size”, as a way to differentiate it from smaller<br />
Mid-size aircraft.<br />
The Challenger 300 has a large and beautiful flat floor cabin,<br />
with a rear baggage compartment that is accessible in-flight.<br />
In its normal configuration the Challenger 300 carries eight<br />
passengers, which makes it ideal for both corporate and<br />
family use. Its cruise range is around 3,100 nautical miles<br />
(5,741 kilometers) at a speed of Mach 0.8. At launch it was<br />
priced at USD$18 million – which was around the same price<br />
as its competitors.<br />
The Honeywell MSP maintenance program that is offered with<br />
the aircraft has proven to be a cost-effective factor, as it reduces<br />
the aircraft’s operating costs, maintenance downtime and helps<br />
preserve the residual value. Having the aircraft enrolled on the<br />
MSP program has made a big difference to the resale value of<br />
the Challenger 300.<br />
The updated Challenger 350 was first revealed in 2013.<br />
Compared to the 300, the Challenger 350 has a longer wingspan,<br />
larger cabin windows, and an upgraded avionics suite. The<br />
engines have also been upgraded and feature a higher thrust<br />
rating for better fuel efficiency. This increases the 350s<br />
maximum takeoff weight and adds a further 100nm in range over<br />
the 300.<br />
In 2020, Bombardier refreshed its best-selling Challenger 350 with a modern interior design inspired by its flagship model, the Global 7500, which features high-speed<br />
Ka-band and an entirely new CMS (Cabin Management System) interface.<br />
58 | ASIAN SKY QUARTERLY — FIRST QUARTER <strong>2022</strong>
PRE-OWNED MARKET SPOTLIGHT: CHALLENGER 300 & 350<br />
FLEET DISTRIBUTION<br />
The Challenger 300 and its successor the Challenger 350 are<br />
amongst the best-selling, and most loved business jets. Its<br />
competitive operational costs and robust design make it perfect<br />
for US domestic coast-to-coast flights, and a good proportion<br />
have also found homes with operators in Europe.<br />
Fleet Distribution by Region<br />
Row Labels Challenger 300 Challenger 350 Grand Total<br />
N. America 391 316 707<br />
W. Europe 21 55 76<br />
S./C. America 16 14 30<br />
E. Europe / W. Asia 10 7 17<br />
Mid. East/Africa 7 2 9<br />
Asia 4 3 7<br />
Australia/Oceania 1 1<br />
Grand Total 450 397 847<br />
Data Source: Amstat<br />
There was a smooth transition in deliveries when the 350 took<br />
over from the 300. A total of 70 Challenger 350s were delivered<br />
in 2015 when the 300 model was phased out of production and<br />
delivery. The average age since delivery for a Challenger 300 is<br />
around 13 years old. For a younger 350, it is about 5 years old.<br />
FIRST QUARTER <strong>2022</strong> — ASIAN SKY QUARTERLY | 59
PRE-OWNED MARKET SPOTLIGHT: CHALLENGER 300 & 350<br />
Fleet Distribution by Year<br />
CL300<br />
CL350<br />
80<br />
70<br />
60<br />
50<br />
40<br />
30<br />
20<br />
10<br />
0<br />
2003 2004 2005 2006 2007 2008 2009 2010 2011 2012 2013 2014 2015 2016 2017 2018 2019 2020 2021 <strong>2022</strong><br />
Data Source: Amstat<br />
According to Amstat, as of May <strong>2022</strong>, NetJets had 85 Challenger<br />
350s in operation, making it the single largest Challenger 350<br />
operator in the world. VistaJet currently has 21 Challenger 350s<br />
in operation. Flexjet, as the Challenger 300’s launch operator,<br />
has a total of 69 Challenger 300/350s. Between them, NetJets,<br />
VistaJet and Flexjet operate around a quarter of all Challenger<br />
300s built.<br />
In the Asia-Pacific market, the Challenger 300 received a<br />
lukewarm reception, as we have seen few operators favor it in<br />
the region. In the Asia-Pacific Business Jet Fleet Report YE2021,<br />
there are only two Challenger 300/350, out of 99 Bombardier<br />
aircraft in mainland China. Across the region there are only eight<br />
Challenger 300/350s in operation – in comparison there are 54<br />
Global 6000 in the region – coast-to-coast travel has not become<br />
a common concept amongst <strong>Asian</strong> travelers, but we expect the<br />
demand for this size category to pick up in the future as we see<br />
demand for shorter range travel increasing.<br />
MARKET CONDITION<br />
In early 2015 the market inventory value (asking price x total<br />
listed fleet for sale) for the Challenger 300 crept above USD$400<br />
million, with more than 40 aircraft on sale. By January 2019,<br />
merely four years later, the inventory value dropped 60% to<br />
USD$150 million with less than 20 aircraft available on the<br />
pre-owned market. On average there were between three to five<br />
transactions each month, which in many brokers’ eyes was a<br />
good sign of recovery in the market at the time.<br />
Pricing-wise, before COVID-19, the market supply for the<br />
Challenger 300 series was quite active. The average asking<br />
price for a Challenger 300 before COVID-19 was stable at<br />
around USD$10 million, with lots of aircraft in the five-to-tenyear<br />
range available.<br />
The pandemic certainly stimulated the pre-owned market, as it<br />
has brought awareness to wealthy and corporate users about<br />
the benefits of flying on business jets, especially as travel<br />
restrictions have helped stimulate very healthy charter demand,<br />
as well as the current frenzy in the pre-owned market.<br />
Given the Challenger 300s characteristics and market reserve, it<br />
has easily become one of the most pursued models on the preowned<br />
market. Although the original Challenger 300 is now out<br />
of production and has an aging fleet, the average asking price<br />
has still increased since mid-2020 due to high market demand.<br />
The same also happened to the Challenger 350. It was very hard<br />
to find an available Challenger 350 between Q4 2021 to <strong>Q1</strong> <strong>2022</strong>.<br />
The percentage of the Challenger 300 fleet for sale has dropped<br />
to just ten aircraft, equivalent to around 2% of all Challenger<br />
300s produced. In a balanced market the percentage available<br />
would be around 8-10%, so it would be fair to say that the<br />
Challenger 300 series is very well favored in the market.<br />
Bombardier has announced a further upgrade called the<br />
Challenger 3500. With the original Challenger 300 series doing<br />
so well it’s hard to see how the 3500 will not be a big seller.<br />
Having said that, it is hard to go wrong with either a pre-owned<br />
or a brand-new aircraft, since for the Challenger 300 series, it is<br />
truly an icon of the industry.<br />
60 | ASIAN SKY QUARTERLY — FIRST QUARTER <strong>2022</strong>
PRE-OWNED MARKET SPOTLIGHT: CHALLENGER 300 & 350<br />
Pre-owned Market Inventory Value: Challenger 300 vs. 350<br />
CL300 Aircraft For Sale<br />
CL300 Inventory Value<br />
CL350 Aircraft For Sale<br />
CL350 Inventory Value<br />
(USD Millions)<br />
500<br />
450<br />
70<br />
400<br />
60<br />
350<br />
50<br />
300<br />
Inventory Value<br />
250<br />
200<br />
40<br />
30<br />
# of Fleet for Sale<br />
150<br />
20<br />
100<br />
10<br />
50<br />
0<br />
0<br />
Jan 15<br />
Apr 15<br />
Jul 15<br />
Oct 15<br />
Jan 16<br />
Apr 16<br />
Jul 16<br />
Oct 16<br />
Jan 17<br />
Apr 17<br />
Jul 17<br />
Oct 17<br />
Jan 18<br />
Apr 18<br />
Jul 18<br />
Oct 18<br />
Jan 19<br />
Apr 19<br />
Jul 19<br />
Oct 19<br />
Jan 20<br />
Apr 20<br />
Jul 20<br />
Oct 20<br />
Jan 21<br />
Apr 21<br />
Jul 21<br />
Oct 21<br />
Jan 22<br />
Data Source: ASG and Amstat<br />
FIRST QUARTER <strong>2022</strong> — ASIAN SKY QUARTERLY | 61
PRE-OWNED MARKET SPOTLIGHT: CHALLENGER 300 & 350<br />
Historical Average Asking Price Trend<br />
CL300 CL350 Avg Asking Price<br />
(USD Millions)<br />
25<br />
20<br />
Average Asking Prices<br />
15<br />
10<br />
5<br />
Market Supply and Demand Trend<br />
Aircraft For Sale<br />
No. of AC Sold<br />
60<br />
50<br />
40 3<br />
5<br />
3<br />
5<br />
2<br />
4<br />
3<br />
1<br />
0 3<br />
30<br />
20<br />
3<br />
2<br />
4<br />
5<br />
4 3<br />
3<br />
4<br />
2 4<br />
7 6 8<br />
6<br />
1<br />
3<br />
2 5<br />
2<br />
5<br />
5<br />
4 5<br />
3 1<br />
2 2 2<br />
7<br />
1<br />
4<br />
2 2 8<br />
5<br />
4 3<br />
7<br />
2 4 4 3<br />
0<br />
4<br />
6 0<br />
2<br />
3<br />
1<br />
6<br />
5<br />
9<br />
6<br />
1 2<br />
4<br />
0 6<br />
1<br />
3<br />
0<br />
4<br />
5<br />
2<br />
1<br />
4<br />
4<br />
4<br />
4<br />
8<br />
5<br />
10<br />
1<br />
8<br />
2 2<br />
2<br />
1<br />
0<br />
31 34 33 30 34 34 39 36 44 44 44 47 42<br />
34 33 33 37 38 39 36<br />
39 40 38 35 30 30 27 27 25<br />
26<br />
37 35 35 38 33 42 40 36<br />
34<br />
36 36 36 35 35 31 31 29 27<br />
25 25 25 21 23 17 14 14 8 7 3 44 45 43 42 27 26 26 21 23 27<br />
36 31<br />
29<br />
25 25 23 22 17 24<br />
23 28<br />
37<br />
34 40 38<br />
4<br />
5<br />
11<br />
Jan 15<br />
Apr 15<br />
Jul 15<br />
Oct 15<br />
Jan 16<br />
Apr 16<br />
Jul 16<br />
Oct 16<br />
Jan 17<br />
Apr 17<br />
Jul 17<br />
Oct 17<br />
Jan 18<br />
Apr 18<br />
Jul 18<br />
Oct 18<br />
Jan 19<br />
Apr 19<br />
Jul 19<br />
Oct 19<br />
Jan 20<br />
Apr 20<br />
Jul 20<br />
Oct 20<br />
Jan 21<br />
Apr 21<br />
Jul 21<br />
Oct 21<br />
Jan 22<br />
Total Market Supply vs. Transactions<br />
Data Source: ASG and Amstat<br />
62 | ASIAN SKY QUARTERLY — FIRST QUARTER <strong>2022</strong>
MARKET<br />
DYNAMICS<br />
BUSINESS JET AND<br />
CIVIL HELICOPTER<br />
PRE-OWNED MARKET<br />
<strong>2022</strong> <strong>Q1</strong><br />
FIRST QUARTER <strong>2022</strong> — ASIAN SKY QUARTERLY | 63
MARKET DYNAMICS: BUSINESS JET<br />
PRE-OWNED BUSINESS JET MARKET <strong>Q1</strong> <strong>2022</strong><br />
Understanding the market dynamics graphs:<br />
The Inventory Value Line represents the number of aircraft actively being marketed for sale in USD terms. 1<br />
The Signal Line represents an indication of where the market’s direction may be heading in the future.<br />
INVENTORY VALUE (USD) 2<br />
$6,576M<br />
WORLDWIDE<br />
$989M<br />
$2,736M<br />
ASIA-PACIFIC<br />
$541M<br />
MARKET TREND 2 WORLDWIDE<br />
TREND REVERSAL<br />
MOVING TOWARDS SELLER’S MARKET<br />
MOVING TOWARDS BUYER’S MARKET<br />
AIRCRAFT TRANSACTIONS 2 WORLDWIDE<br />
138<br />
113<br />
80<br />
34<br />
47<br />
33<br />
40<br />
41 41<br />
47<br />
44<br />
58<br />
41<br />
59<br />
39<br />
30<br />
21<br />
22<br />
34<br />
50<br />
33<br />
52<br />
64<br />
39<br />
40<br />
62<br />
65<br />
56<br />
55 54<br />
48<br />
52<br />
62<br />
42<br />
46<br />
38<br />
38<br />
Mar Apr<br />
2019<br />
May Jun Jul Aug Sep Oct Nov Dec Jan Feb Mar Apr May Jun Jul Aug Sep Oct Nov Dec Jan Feb Mar Apr May Jun Jul Aug Sep Oct Nov Dec Jan Feb Mar<br />
2020<br />
2021<br />
<strong>2022</strong><br />
1 ASM’s Inventory Value line is calculated by taking the total number of aircraft for sale from a selection of 39 different models, multiplied by their average asking prices.<br />
2 The historical inventory value and transactions are subject to change based on latest market information updates.<br />
64 | ASIAN SKY QUARTERLY — FIRST QUARTER <strong>2022</strong>
MARKET DYNAMICS: BUSINESS JET<br />
WORLDWIDE % OF FLEET SOLD<br />
2.60%<br />
2.50%<br />
2.40%<br />
2.30%<br />
2.20%<br />
2.10%<br />
2.00%<br />
1.90%<br />
1.80%<br />
1.70%<br />
1.60%<br />
1.50%<br />
1.40%<br />
1.30%<br />
1.20%<br />
1.10%<br />
1.00%<br />
0.90%<br />
0.80%<br />
0.70%<br />
0.60%<br />
0.50%<br />
0.40%<br />
0.30%<br />
0.20%<br />
Mar<br />
2019<br />
May Jul Sep Nov Jan Mar May Jul Sep Nov Jan Mar May Jul Sep Nov Jan<br />
2020<br />
2021<br />
<strong>2022</strong><br />
AVERAGE ASKING PRICE<br />
Mar<br />
MILLION USD<br />
28<br />
26<br />
24<br />
22<br />
20<br />
ASIA-PACIFIC<br />
18<br />
16<br />
WORLDWIDE<br />
14<br />
12<br />
10<br />
% OF FLEET FOR SALE<br />
9%<br />
Mar<br />
2019<br />
May Jul Sep Nov Jan Mar May Jul Sep Nov Jan Mar May Jul Sep Nov Jan<br />
2020<br />
2021<br />
<strong>2022</strong><br />
ASIA-PACIFIC<br />
Mar<br />
8%<br />
7%<br />
6%<br />
5%<br />
4%<br />
WORLDWIDE<br />
3%<br />
2%<br />
AVERAGE DAYS ON MARKET<br />
700<br />
Mar<br />
2019<br />
May Jul Sep Nov Jan Mar May Jul Sep Nov Jan Mar May Jul Sep Nov Jan<br />
2020<br />
2021<br />
<strong>2022</strong><br />
Mar<br />
650<br />
600<br />
550<br />
500<br />
450<br />
ASIA-PACIFIC<br />
400<br />
350<br />
300<br />
WORLDWIDE<br />
250<br />
200<br />
Mar<br />
2019<br />
May Jul Sep Nov Jan Mar May Jul Sep Nov Jan Mar May Jul Sep Nov Jan<br />
2020<br />
2021<br />
<strong>2022</strong><br />
Mar<br />
FIRST QUARTER <strong>2022</strong> — ASIAN SKY QUARTERLY | 65
MARKET DYNAMICS: BUSINESS JET<br />
SUPPLY / DEMAND INDICATORS<br />
BUSINESS JETS<br />
SUPPLY VS. DEMAND RATIO<br />
AVERAGE DAYS ON MARKET<br />
SUPPLY<br />
> DEMAND<br />
DAYS ON MARKET<br />
AVERAGE<br />
% OF FLEET<br />
FOR SALE<br />
MODEL<br />
AVERAGE<br />
NO TRANSACTION<br />
NO TRANSACTION<br />
NO TRANSACTION<br />
NO TRANSACTION<br />
450% 400% 350% 300% 250% 200% 150% 100% 50% 0<br />
Average AC for sale / Total sold in last 12 months<br />
11.1%<br />
4.3%<br />
4.8%<br />
6.1%<br />
9.1%<br />
2.2%<br />
0.3%<br />
2.5%<br />
1.7%<br />
0.8%<br />
6.8%<br />
5.0%<br />
4.9%<br />
1.7%<br />
1.2%<br />
0.8%<br />
1.9%<br />
0.3%<br />
0.9%<br />
0.0%<br />
0.9%<br />
2.1%<br />
1.2%<br />
6.7%<br />
1.0%<br />
1.9%<br />
ACJ318<br />
ACJ319<br />
ACJ320<br />
BBJ<br />
BBJ2<br />
CL300<br />
CL350<br />
CL604<br />
CL605<br />
CL650<br />
CL850<br />
GL Express<br />
GL XRS<br />
GL5000<br />
GL6000<br />
CIT. CJ3<br />
CIT. CJ4<br />
CIT. Latitude<br />
CIT. Sovereign<br />
F2000LX<br />
F2000LXS<br />
F2000S<br />
0.3% F7X<br />
0.0%<br />
0.0%<br />
F8X<br />
F900DX<br />
0.8% F900EX<br />
1.7%<br />
0.8%<br />
3.8%<br />
0.9%<br />
1.7%<br />
1.2%<br />
1.1%<br />
2.2%<br />
2.4%<br />
1.7%<br />
Average<br />
F900EXe<br />
F900LX<br />
L1000<br />
L600<br />
L650<br />
Phenom 300<br />
G200<br />
G280<br />
G450<br />
G500<br />
G550<br />
G650<br />
G650ER<br />
0 200 400 600 800 1000<br />
The above chart reflects where certain aircraft models are positioned<br />
in terms of supply and demand (based on a ratio of completed<br />
transactions compared to the number of sellers and the average<br />
number of days on the market for a transaction to take place).<br />
These indications do not necessarily mean that prices will be higher<br />
in the future, but it does indicate that sellers of these particular<br />
models are more likely to find willing buyers in a shorter period of<br />
time than on average.<br />
For some model types, given the market indicators shown on the<br />
previous page, the stabilization in pre-owned asking prices and decline<br />
in inventory level appear to have stimulated increased demand,<br />
leading to an increase in transactions and a more balanced state of<br />
supply and demand.<br />
This can be seen the most with certain Gulfstream (G200, G450, G550,<br />
G650), Bombardier (Challenger 604/605 & Global 5000) and Dassault<br />
Falcon models (2000 Series and 7X), where more transactions are<br />
occurring relative to the number for sale, and transactions are requiring<br />
less time on the market for sellers to complete.<br />
66 | ASIAN SKY QUARTERLY — FIRST QUARTER <strong>2022</strong>
MARKET DYNAMICS: BUSINESS JET<br />
MARKET POSITIONING<br />
BUSINESS JETS<br />
MOVING TOWARDS<br />
BUYER’S MARKET<br />
Balanced<br />
Supply & Demand<br />
MOVING TOWARDS<br />
SELLER’S MARKET<br />
ACJ318<br />
ACJ319<br />
ACJ320<br />
BBJ 1<br />
BBJ 2<br />
CL300<br />
CL350<br />
CL604<br />
CL605<br />
CL650<br />
CL850<br />
GL Express<br />
GL XRS<br />
GL5000<br />
GL6000<br />
CIT. CJ3<br />
CIT. CJ4<br />
CIT. Latitude<br />
CIT. Sovereign<br />
F2000LX<br />
F2000LXS<br />
F2000S<br />
F7X<br />
F8X<br />
F900DX<br />
F900EX<br />
F900EX EASy<br />
F900LX<br />
L1000<br />
L600<br />
L650<br />
Phenom 300<br />
G200<br />
G280<br />
G450<br />
G500<br />
G550<br />
G650<br />
G650ER<br />
The above chart provides a visual representation of the supply /<br />
demand ratio of each aircraft model relative to the overall market,<br />
and is based on a ‘Marketability’ calculation for each particular<br />
model including the following four market indicators:<br />
1. The percentage of aircraft for sale relative to its fleet size.<br />
2. The number of aircraft sold relative to the average number for sale.<br />
3. The average days for sale relative to the overall market average.<br />
4. The momentum of the marketplace (represented by the trend<br />
towards supply and demand market equilibrium portrayed earlier).<br />
When taking into account these four factors, most of the large<br />
and medium sized jets, such as the Challenger 600, Falcon 2000<br />
& 900 Series, as well as various Gulfstream models, appear<br />
better positioned to find buyers available, compared to corporate<br />
airliner models.<br />
* Since 2019 Q3, ASM expanded its market research scope to<br />
include 39 business jet models including light jet models as<br />
described in the report.<br />
FIRST QUARTER <strong>2022</strong> — ASIAN SKY QUARTERLY | 67
MARKET DYNAMICS: CIVIL HELICOPTERS<br />
PRE-OWNED HELICOPTERS MARKET <strong>Q1</strong> <strong>2022</strong><br />
Understanding the market dynamics graphs:<br />
The Inventory Value Line represents the number of aircraft actively being marketed for sale in USD terms. 1<br />
The Signal Line represents an indication of where the market’s direction may be heading in the future.<br />
INVENTORY VALUE (USD) 2<br />
$1,371M<br />
WORLDWIDE<br />
ASIA-PACIFIC<br />
$152M<br />
$732M<br />
$116M<br />
MARKET TREND 2 WORLDWIDE<br />
TREND IMPROVEMENT<br />
MOVING TOWARDS SELLER’S MARKET<br />
MOVING TOWARDS BUYER’S MARKET<br />
AIRCRAFT TRANSACTIONS 2 WORLDWIDE<br />
50<br />
18<br />
34<br />
31<br />
34<br />
28<br />
26<br />
18<br />
21<br />
19<br />
24<br />
32<br />
27<br />
31<br />
24<br />
30<br />
22<br />
14<br />
20<br />
31<br />
15<br />
27<br />
31<br />
32<br />
28<br />
29<br />
39<br />
32<br />
34<br />
29<br />
26<br />
20<br />
20<br />
29<br />
36<br />
28<br />
6<br />
Mar Apr<br />
2019<br />
May Jun Jul Aug Sep Oct Nov Dec Jan Feb Mar Apr May Jun Jul Aug Sep Oct Nov Dec Jan Feb Mar Apr May Jun Jul Aug Sep Oct Nov Dec Jan Feb Mar<br />
2020<br />
2021<br />
<strong>2022</strong><br />
1 ASM’s inventory value line is calculated by taking the total number of aircraft for sale from a selection of 39 different models, multiplied by their average asking prices.<br />
2 The historical inventory value and transactions are subject to change based on latest market information updates.<br />
68 | ASIAN SKY QUARTERLY — FIRST QUARTER <strong>2022</strong>
MARKET DYNAMICS: CIVIL HELICOPTERS<br />
% OF AIRCRAFT SOLD / TOTAL AIRCRAFT IN OPERATION<br />
0.50%<br />
0.45%<br />
0.40%<br />
0.35%<br />
0.30%<br />
0.25%<br />
0.20%<br />
0.15%<br />
0.10%<br />
0.05%<br />
0.00%<br />
Mar<br />
2019<br />
May Jul Sep Nov Jan Mar May Jul Sep Nov Jan Mar May Jul Sep Nov Jan<br />
2020<br />
2021<br />
<strong>2022</strong><br />
AVERAGE ASKING PRICE<br />
Mar<br />
MILLION USD<br />
3.4<br />
3.2<br />
ASIA-PACIFIC<br />
3.0<br />
2.8<br />
2.6<br />
WORLDWIDE<br />
2.4<br />
2.2<br />
2.0<br />
Mar<br />
2019<br />
May Jul Sep Nov Jan Mar May Jul Sep Nov Jan Mar May Jul Sep Nov Jan<br />
2020<br />
2021<br />
<strong>2022</strong><br />
Mar<br />
% OF AIRCRAFT FOR SALE<br />
5.0%<br />
4.5%<br />
WORLDWIDE<br />
4.0%<br />
3.5%<br />
ASIA-PACIFIC<br />
3.0%<br />
2.5%<br />
2.0%<br />
1.5%<br />
750<br />
Mar<br />
2019<br />
May Jul Sep Nov Jan Mar May Jul Sep Nov Jan Mar May Jul Sep Nov Jan<br />
2020<br />
2021<br />
<strong>2022</strong><br />
AVERAGE DAYS ON MARKET<br />
Mar<br />
700<br />
650<br />
600<br />
WORLDWIDE<br />
ASIA-PACIFIC<br />
550<br />
500<br />
450<br />
400<br />
350<br />
Mar<br />
2019<br />
May Jul Sep Nov Jan Mar May Jul Sep Nov Jan Mar May Jul Sep Nov Jan<br />
2020<br />
2021<br />
<strong>2022</strong><br />
Mar<br />
FIRST QUARTER <strong>2022</strong> — ASIAN SKY QUARTERLY | 69
MARKET DYNAMICS: CIVIL HELICOPTERS<br />
SUPPLY / DEMAND INDICATORS<br />
HELICOPTERS<br />
SUPPLY VS. DEMAND RATIO<br />
SUPPLY / DEMAND INDICATORS<br />
SUPPLY<br />
> DEMAND<br />
DAYS ON MARKET<br />
AVERAGE<br />
% FOR SALE MODEL<br />
AVERAGE<br />
1.2%<br />
EC145<br />
1.9%<br />
H125<br />
2.2%<br />
H130<br />
1.0%<br />
H145<br />
NO TRANSACTION<br />
7.2%<br />
H155<br />
4.5%<br />
EC135P2<br />
NO TRANSACTION<br />
2.2%<br />
EC135T2<br />
0.0%<br />
EC155B<br />
3.1%<br />
BELL<br />
206JETRANGER<br />
3.3%<br />
BELL<br />
206LONGRANGER<br />
1.7%<br />
BELL 407<br />
3.8%<br />
BELL 412EP<br />
2.2%<br />
BELL 412HP<br />
0.7%<br />
BELL 429<br />
4.4%<br />
AW109SP GN<br />
2.0%<br />
AW139<br />
10.0%<br />
S76C+<br />
350% 300% 250% 200% 150% 100% 50% 0 2.68%<br />
0 100 200 300 400 500 600 700 800<br />
Average<br />
Average AC for sale / Total sold in last 12 months<br />
Average Days for Sale on Market<br />
The above chart reflects where certain aircraft models are positioned<br />
in terms of supply and demand (based on a ratio of completed<br />
transactions compared to the number of sellers, and average number<br />
of days on the market for a transaction to take place).<br />
70 | ASIAN SKY QUARTERLY — FIRST QUARTER <strong>2022</strong>
MARKET DYNAMICS: CIVIL HELICOPTERS<br />
MARKET POSITIONING<br />
HELICOPTERS<br />
MOVING TOWARDS<br />
BUYER’S MARKET<br />
Balanced<br />
Supply & Demand<br />
MOVING TOWARDS<br />
SELLER’S MARKET<br />
EC145<br />
H125<br />
H130<br />
H145<br />
H155<br />
EC135P2<br />
EC135T2<br />
EC155B<br />
BELL 206JETRANGER<br />
BELL 206LONGRANGER<br />
BELL 407<br />
BELL 412EP<br />
BELL 412HP<br />
BELL 429<br />
AW109SP GN<br />
AW139<br />
S76C+<br />
The above chart provides a visual representation of the supply / demand ratio of each aircraft model relative to the overall market,<br />
resulting in a ‘Marketability’ calculation of each particular model based on the following four market indicators:<br />
1. The percentage of aircraft for sale relative to its fleet size.<br />
2. The number of aircraft sold relative to the average number for sale.<br />
3. The average days for sale relative to the overall market average.<br />
4. The momentum of the marketplace (represented by the trend towards supply and demand market equilibrium portrayed earlier).<br />
FIRST QUARTER <strong>2022</strong> — ASIAN SKY QUARTERLY | 71
MARKET<br />
SUMMARY<br />
BUSINESS JETS<br />
<strong>2022</strong> <strong>Q1</strong><br />
72 | ASIAN SKY QUARTERLY — FIRST QUARTER <strong>2022</strong>
AIRCRAFT POSITIONING<br />
AIRCRAFT ACQUISITION VS. MAX RANGE<br />
22<br />
21<br />
20<br />
19<br />
18<br />
17<br />
16<br />
15<br />
14<br />
13<br />
12<br />
11<br />
10<br />
CORP. AIRLINER<br />
LONG RANGE<br />
LARGE<br />
MEDIUM<br />
LIGHT<br />
VERY LIGHT<br />
F2000<br />
MARKET SUMMARY: BUSINESS JETS<br />
BBJ MAX 9<br />
BBJ3 BBJ MAX 8<br />
BBJ2<br />
ACJ320 NEO<br />
ACJ319 NEO<br />
ACJ321 ACJ319<br />
G650<br />
ACJ320<br />
G650ER<br />
F900EX<br />
GLOBAL 6000<br />
F8X<br />
LINEAGE 1000E<br />
G600<br />
GLOBAL 5000<br />
F7X<br />
G-IVSP<br />
GLOBAL 5500<br />
G300<br />
F2000EX<br />
G550<br />
CL604 ACJ318 G500<br />
BBJ<br />
TOTAL ANNUAL COST (MILLION USD/YEAR)<br />
9<br />
8<br />
7<br />
6<br />
4<br />
3<br />
CIT. BRAVO<br />
CIT. EXCEL<br />
H400XP<br />
H800<br />
CIT. XLS<br />
CIT. ULTRA<br />
CIT. XLS+<br />
CIT. CJ4<br />
CIT. CJ3+<br />
CIT. VII<br />
LEGACY 600<br />
LEGACY 500<br />
CL850<br />
CIT. X+<br />
CL300<br />
CIT. LATITUDE<br />
CIT. SOVEREIGN+<br />
L70<br />
L75<br />
L45XR<br />
LEGACY 450<br />
H850XP<br />
ASTRA SP<br />
L40XR<br />
PHENOM 300<br />
CIT. ENCORE+<br />
CIT. LONGITUDE<br />
F2000S<br />
CL350<br />
G280<br />
CIT. X<br />
H4000<br />
G350<br />
CIT. SOVEREIGN<br />
G150<br />
H900XP<br />
H800XP<br />
CIT. CJ4 GEN2<br />
LX60XR<br />
G100<br />
G-IV<br />
F2000LXS<br />
CL650<br />
G450<br />
LEGACY 650<br />
F900LX<br />
F6X<br />
F900EX EASY<br />
PRAETOR 600<br />
F2000LX<br />
CL605<br />
F2000DX<br />
F50EX<br />
PRAETOR 500<br />
G200<br />
G-V<br />
GLOBAL EXPRESS<br />
G700**<br />
GLOBAL EXPRESS XRS<br />
F10X**<br />
2<br />
CIT. M2<br />
PREMIER 1A<br />
CIT. CJ1+<br />
CIT. CJ1<br />
HONDAJET<br />
CIT. CJ2+<br />
CIT. CJ3<br />
CIT. CJ2<br />
PHENOM 100E<br />
NEXTANT 400XTI<br />
CIT. ENCORE<br />
HONDAJET ELITE<br />
CIT. MUSTANG<br />
ECLIPSE 550<br />
VISION SF50 G2<br />
VISION SF50<br />
1<br />
500<br />
1,000<br />
1,500<br />
2,000<br />
*Total yearly cost estimated using includes Conklin & de Decker industrial cost figures (2021) for aircraft acquisition cost on 10 years, plus yearly operating cost. **Under development,<br />
preliminary data provided by OEM.<br />
(‘xx) - Year aircraft model ceased production.<br />
Source: Conklin & de Decker<br />
2,500<br />
MAX RANGE (N.M.)<br />
3,000<br />
3,500<br />
4,000<br />
4,500<br />
5,000<br />
5,500<br />
6,000<br />
6,500<br />
7,000<br />
7,500<br />
8,000<br />
8,500<br />
9,000<br />
9,500<br />
10,000<br />
FIRST QUARTER <strong>2022</strong> — ASIAN SKY QUARTERLY | 73
MARKET SUMMARY: BUSINESS JETS<br />
MARKET SUMMARY PER MODEL<br />
INVENTORY LEVEL, PRICE TREND & TRANSACTIONS<br />
ACJ318, ACJ319 & ACJ320<br />
PERFORMANCE<br />
Max Range<br />
Max Speed<br />
Typ. Passengers<br />
ACJ318<br />
4,253 N.M. / 7,877 km<br />
Mach 0.82<br />
19<br />
ACJ319<br />
6,000 N.M. / 11,112 km<br />
Mach 0.82<br />
19<br />
ACJ320<br />
5,250 N.M. / 9,723 km<br />
Mach 0.82<br />
19<br />
SUPPLY<br />
No. for Sale<br />
Avg Asking Price<br />
Avg Days on Market<br />
Mar<br />
2 (11.1%)<br />
26.5M USD<br />
180<br />
Dec<br />
2 (11.1%)<br />
26.5M USD<br />
573<br />
Mar<br />
3 (4.3%)<br />
39.5M USD<br />
215<br />
Dec<br />
3 (4.3%)<br />
39.5M USD<br />
572<br />
Mar<br />
1 (4.8%)<br />
39.5M USD<br />
1,206<br />
Dec<br />
1 (4.8%)<br />
39.5M USD<br />
1,296<br />
TRANSACTION<br />
Past 12 Months<br />
Past 3 Months<br />
Mar<br />
0<br />
0<br />
Dec<br />
0<br />
0<br />
Mar<br />
2<br />
0<br />
Dec<br />
2<br />
0<br />
Mar<br />
0<br />
0<br />
Dec<br />
0<br />
0<br />
Average Asking Price<br />
$43.0M<br />
$42.0M $42.0M $42.0M<br />
$39.5M<br />
$39.5M $39.5M $39.5M<br />
ACJ318<br />
ACJ320<br />
ACJ319<br />
Average<br />
$39.5M $39.5M $39.5M<br />
$39.5M $39.5M $39.5M<br />
Market Indicators (vs. Last Quarter)<br />
ACJ318<br />
Transaction Level (Past 12 Months)<br />
Inventory Level<br />
Average Asking Price<br />
Average Days on Market<br />
$25.2M<br />
$25.2M<br />
For Sale vs. Sold<br />
$23.0M<br />
$25.0M<br />
$22.0M<br />
$26.5M<br />
$26.5M<br />
ACJ319<br />
Transaction Level (Past 12 Months)<br />
Inventory Level<br />
Average Asking Price<br />
Sold<br />
For Sale<br />
Average Days on Market<br />
1 1 1<br />
1<br />
1<br />
8 8 7 7 7 7 7 6 7 7 7 5 5 7 6 6 5 5 5 5 6 6 6 5 6<br />
Mar May Jul Sep Nov Jan Mar May Jul Sep Nov Jan Mar<br />
2020 2021 <strong>2022</strong><br />
ACJ320<br />
Transaction Level (Past 12 Months)<br />
Inventory Level<br />
Average Asking Price<br />
Average Days on Market<br />
Source: AMSTAT & ASG<br />
74 | ASIAN SKY QUARTERLY — FIRST QUARTER <strong>2022</strong>
MARKET SUMMARY: BUSINESS JETS<br />
BBJ & BBJ2<br />
PERFORMANCE<br />
Max Range<br />
Max Speed<br />
Typ. Passengers<br />
BBJ<br />
6,235 N.M. / 11,547 km<br />
Mach 0.82<br />
19<br />
BBJ2<br />
5,620 N.M. / 10,408 km<br />
Mach 0.82<br />
19<br />
SUPPLY<br />
No. for Sale<br />
Avg Asking Price<br />
Avg Days on Market<br />
Mar<br />
8 (6.1%)<br />
38.0M USD<br />
262<br />
Dec<br />
9 (6.8%)<br />
15.5M USD<br />
315<br />
Mar<br />
2 (9.1%)<br />
29.0M USD<br />
238<br />
Dec<br />
2 (13.6%)<br />
29.0M USD<br />
150<br />
TRANSACTION<br />
Past 12 Months<br />
Past 3 Months<br />
Mar<br />
8<br />
4<br />
Dec<br />
4<br />
3<br />
Mar<br />
1<br />
1<br />
Dec<br />
0<br />
0<br />
Average Asking Price<br />
BBJ2<br />
Market Indicators (vs. Last Quarter)<br />
$90.0M $90.0M $90.0M<br />
$90.0M<br />
BBJ<br />
Average<br />
BBJ<br />
Transaction Level (Past 12 Months)<br />
Inventory Level<br />
$29.0M<br />
$29.0M<br />
$38.0M<br />
Average Asking Price<br />
Average Days on Market<br />
$28.3M<br />
$20.9M<br />
$22.3M<br />
$28.5M<br />
$19.1M<br />
$15.5M<br />
$29.0M<br />
For Sale vs. Sold<br />
1<br />
12<br />
Sold<br />
1<br />
For Sale<br />
1 2 1<br />
9 10 7 7 7 7 7 7 8 9 9 9 10 9 9 9 11 11 11 11 12 11 9 10<br />
FEATURED AIRCRAFT<br />
1 1<br />
1 1<br />
Mar May Jul Sep Nov Jan Mar May Jul Sep Nov Jan Mar<br />
2020 2021 <strong>2022</strong><br />
3<br />
2<br />
BBJ2<br />
Transaction Level (Past 12 Months)<br />
Inventory Level<br />
Average Asking Price<br />
Average Days on Market<br />
Source: AMSTAT & ASG<br />
BBJ 787-8<br />
TOTAL HOURS: DELIVERY HOURS<br />
TOTAL CYCLES: DELIVERY CYCLES<br />
• Interior completed 2019<br />
• Brand new aircraft with delivery hours & cycles only<br />
• One of the longest ranged business jet - capable of flying 16 hours non-stop<br />
• 39 Passenger vvip configuration, with 2,415 square feet (224 square<br />
meters) living space including: a master suite, vip lounge, dining lounge,<br />
business class, fwd & aft galley, crew rest area and a gym.<br />
• Aero H+ Satcom w/ Ku-Band high speed internet<br />
• State-of-the-art avionics, including: new, latest generation FMC; SELCAL,<br />
ADS, FANS-1 & CPDLC; dual head-up displays; weather radar, TCAS &<br />
TAWS; approved for GLS II approaches<br />
FIRST QUARTER <strong>2022</strong> — ASIAN SKY QUARTERLY | 75
MARKET SUMMARY: BUSINESS JETS<br />
CHALLENGER 300 & 350<br />
PERFORMANCE<br />
Max Range<br />
Max Speed<br />
Typ. Passengers<br />
CL300<br />
3,340 N.M. / 6,185 km<br />
Mach 0.82<br />
19<br />
CL350<br />
3,421 N.M. / 6,335 km<br />
Mach 0.82<br />
19<br />
SUPPLY<br />
No. for Sale<br />
Avg Asking Price<br />
Avg Days on Market<br />
Mar<br />
10 (2.2%)<br />
12.3M USD<br />
168<br />
Dec<br />
3 (0.7%)<br />
9.8M USD<br />
429<br />
Mar<br />
1 (0.3%)<br />
16.9M USD<br />
5<br />
Dec<br />
0 (0.0%)<br />
0.0M USD<br />
0<br />
TRANSACTION<br />
Past 12 Months<br />
Past 3 Months<br />
Mar<br />
41<br />
4<br />
Dec<br />
37<br />
9<br />
Mar<br />
17<br />
1<br />
Dec<br />
16<br />
7<br />
Average Asking Price<br />
CL350<br />
Market Indicators (vs. Last Quarter)<br />
CL300<br />
Average<br />
$14.9M<br />
$8.0M<br />
$14.4M<br />
$7.4M<br />
$17.0M<br />
$8.0M<br />
$15.7M<br />
$8.1M<br />
$16.3M<br />
$8.9M<br />
$19.6M<br />
$9.8M<br />
$16.9M<br />
$12.3M<br />
CL300<br />
Transaction Level (Past 12 Months)<br />
Inventory Level<br />
Average Asking Price<br />
Average Days on Market<br />
For Sale vs. Sold<br />
Sold For Sale<br />
5<br />
1 2 6<br />
4<br />
1<br />
3 6<br />
4<br />
2 5<br />
1<br />
4<br />
4 4<br />
4 8<br />
5<br />
2 8 1<br />
2<br />
1 2<br />
34 42 40 40 38 36 35 31 31 29 25 27 25 25 21 23 17 14 14 8 7 3 4 5 11<br />
Mar May Jul Sep Nov Jan Mar May Jul Sep Nov Jan Mar<br />
2020 2021 <strong>2022</strong><br />
CL350<br />
Transaction Level (Past 12 Months)<br />
Inventory Level<br />
Average Asking Price<br />
Average Days on Market<br />
Source: AMSTAT & ASG<br />
76 | ASIAN SKY QUARTERLY — FIRST QUARTER <strong>2022</strong>
MARKET SUMMARY: BUSINESS JETS<br />
CHALLENGER 604, 605 & 650<br />
PERFORMANCE<br />
Max Range<br />
Max Speed<br />
Typ. Passengers<br />
CL604<br />
4,027 N.M. / 7,458 km<br />
Mach 0.82<br />
9<br />
CL605<br />
4,123 N.M. / 7,635 km<br />
Mach 0.82<br />
9<br />
CL650<br />
4,123 N.M. / 7,635 km<br />
Mach 0.82<br />
10<br />
SUPPLY<br />
No. for Sale<br />
Avg Asking Price<br />
Avg Days on Market<br />
Mar<br />
9 (2.5%)<br />
7.8M USD<br />
148<br />
Dec<br />
11 (3.1%)<br />
5.3M USD<br />
286<br />
Mar<br />
5 (1.7%)<br />
12.9M USD<br />
83<br />
Dec<br />
3 (1.0%)<br />
7.5M USD<br />
171<br />
Mar<br />
1 (0.8%)<br />
16.8M USD<br />
23<br />
Dec<br />
3 (2.6%)<br />
18.0M USD<br />
85<br />
TRANSACTION<br />
Past 12 Months<br />
Past 3 Months<br />
Mar<br />
54<br />
10<br />
Dec<br />
44<br />
14<br />
Mar<br />
25<br />
3<br />
Dec<br />
22<br />
12<br />
Mar<br />
11<br />
7<br />
Dec<br />
4<br />
1<br />
Average Asking Price<br />
CL650<br />
CL604<br />
CL605<br />
Average<br />
$17.5M<br />
$18.5M<br />
$17.0M $16.7M $16.5M $16.5M<br />
$10.2M $9.9M<br />
$8.7M $8.1M $7.4M $7.5M<br />
$16.8M<br />
$12.1M<br />
Market Indicators (vs. Last Quarter)<br />
CL604<br />
Transaction Level (Past 12 Months)<br />
Inventory Level<br />
Average Asking Price<br />
Average Days on Market<br />
$4.8M<br />
$4.7M<br />
$4.6M $4.6M $3.8M<br />
$4.7M<br />
$7.8M<br />
CL605<br />
Transaction Level (Past 12 Months)<br />
Inventory Level<br />
For Sale vs. Sold<br />
Sold For Sale<br />
Average Asking Price<br />
Average Days on Market<br />
4<br />
4<br />
5 6<br />
1 2<br />
8<br />
8<br />
14<br />
18<br />
4<br />
5<br />
10<br />
56 62 65 67 67 66 75 72 69 59 55 53 48 47 45 42 39 38 34 22 16 17 13 15 15<br />
Mar May Jul Sep Nov Jan Mar May Jul Sep Nov Jan Mar<br />
7<br />
7<br />
9<br />
6<br />
4<br />
8<br />
7<br />
2<br />
8<br />
6 7<br />
3<br />
2020 2021 <strong>2022</strong><br />
CL650<br />
Transaction Level (Past 12 Months)<br />
Inventory Level<br />
Average Asking Price<br />
Average Days on Market<br />
Source: AMSTAT & ASG<br />
FIRST QUARTER <strong>2022</strong> — ASIAN SKY QUARTERLY | 77
MARKET SUMMARY: BUSINESS JETS<br />
CHALLENGER 850<br />
Average Asking Price<br />
Market Indicators (vs. Last Quarter)<br />
$6.8M<br />
$9.5M<br />
For Sale vs. Sold<br />
Sold<br />
11<br />
1<br />
1<br />
For Sale<br />
1<br />
2<br />
$4.6M<br />
$5.0M<br />
12 13 14 14 15 15 12 13 12 11 9 9<br />
1<br />
1<br />
$4.7M<br />
$4.8M<br />
$5.7M<br />
7 6 6 6 6 5 7 7 6 3 3 6<br />
Mar May Jul Sep Nov Jan Mar May Jul Sep Nov Jan Mar<br />
1<br />
1 1<br />
2020 2021 <strong>2022</strong><br />
1<br />
1<br />
1<br />
2<br />
1<br />
PERFORMANCE<br />
Max Range<br />
Max Speed<br />
Typ. Passengers<br />
SUPPLY<br />
No. for Sale<br />
Avg Asking Price<br />
Avg Days on Market<br />
TRANSACTION<br />
Past 12 Months<br />
Past 3 Months<br />
Transaction Level (Past 12 Months)<br />
Inventory Level<br />
Average Asking Price<br />
Average Days on Market<br />
6,750 N.M. / 12,501 km<br />
Mach 0.87<br />
18<br />
Mar<br />
6 (6.8%)<br />
5.7M USD<br />
167<br />
Mar<br />
12<br />
1<br />
Dec<br />
6 (6.7%)<br />
4.8M USD<br />
394<br />
Dec<br />
11<br />
6<br />
Source: AMSTAT & ASG<br />
78 | ASIAN SKY QUARTERLY — FIRST QUARTER <strong>2022</strong>
MARKET SUMMARY: BUSINESS JETS<br />
GLOBAL EXPRESS, 5000, XRS & 6000<br />
PERFORMANCE<br />
Max Range<br />
Max Speed<br />
Typ. Passengers<br />
GLOBAL 5000<br />
5,350 N.M. / 9,908 km<br />
Mach 0.82<br />
13<br />
GLOBAL EXPRESS<br />
6,125 N.M. / 11,343 km<br />
Mach 0.82<br />
13<br />
GLOBAL XRS<br />
6,226 N.M. / 11,520 km<br />
Mach 0.82<br />
13<br />
GLOBAL 6000<br />
6,080 N.M. / 11,260 km<br />
Mach 0.82<br />
13<br />
SUPPLY<br />
No. for Sale<br />
Avg Asking Price<br />
Avg Days on Market<br />
Mar<br />
4 (1.79%)<br />
14.0M USD<br />
344<br />
Dec<br />
3 (1.3%)<br />
14.0M USD<br />
693<br />
Mar<br />
7 (6.4%)<br />
6.5M USD<br />
658<br />
Dec<br />
9 (9.9%)<br />
11.0M USD<br />
625<br />
Mar<br />
8 (4.9%)<br />
15.0M USD<br />
379<br />
Dec<br />
11 (6.8%)<br />
15.2M USD<br />
400<br />
Mar<br />
4 (1.2%)<br />
28.0M USD<br />
107<br />
Dec<br />
9 (2.8%)<br />
22.9M USD<br />
195<br />
TRANSACTION<br />
Past 12 Months<br />
Past 3 Months<br />
Mar<br />
25<br />
6<br />
Dec<br />
19<br />
9<br />
Mar<br />
22<br />
5<br />
Dec<br />
17<br />
11<br />
Mar<br />
25<br />
3<br />
Dec<br />
22<br />
13<br />
Mar<br />
38<br />
15<br />
Dec<br />
37<br />
23<br />
Average Asking Price<br />
$31.1M<br />
$17.0M<br />
$14.4M<br />
$9.0M<br />
3<br />
70<br />
2<br />
2 8<br />
73 78 77<br />
$30.5M<br />
$16.1M<br />
$14.8M<br />
For Sale vs. Sold<br />
Sold<br />
For Sale<br />
4<br />
$27.0M<br />
$14.5M<br />
$13.6M<br />
8 6 7 6 11<br />
6<br />
$26.0M<br />
$14.9M<br />
$15.0M<br />
GL EXPRESS<br />
GL XRS<br />
GL6000<br />
8 3<br />
5 5 5<br />
$25.1M<br />
$14.7M<br />
$14.4M<br />
$8.2M $7.5M<br />
$8.0M $8.4M<br />
75 81 82 79 81 80 69 73 70 79 73 71 63 56 52 47 41 32 21 25 23<br />
9<br />
9<br />
5<br />
8<br />
GL5000<br />
Average<br />
$27.0M<br />
$15.3M<br />
$10.5M<br />
7<br />
$13.0M<br />
21<br />
7<br />
9<br />
$28.0M<br />
$15.0M<br />
$14.0M<br />
$6.5M<br />
Mar May Jul Sep Nov Jan Mar May Jul Sep Nov Jan Mar<br />
2020 2021 <strong>2022</strong><br />
4<br />
Market Indicators (vs. Last Quarter)<br />
GLOBAL 5000<br />
Transaction Level (Past 12 Months)<br />
Inventory Level<br />
Average Asking Price<br />
Average Days on Market<br />
GLOBAL EXPRESS<br />
Transaction Level (Past 12 Months)<br />
Inventory Level<br />
Average Asking Price<br />
Average Days on Market<br />
GLOBAL XRS<br />
Transaction Level (Past 12 Months)<br />
Inventory Level<br />
Average Asking Price<br />
Average Days on Market<br />
GLOBAL 6000<br />
Transaction Level (Past 12 Months)<br />
Inventory Level<br />
Average Asking Price<br />
Average Days on Market<br />
Source: AMSTAT & ASG<br />
FIRST QUARTER <strong>2022</strong> — ASIAN SKY QUARTERLY | 79
MARKET SUMMARY: BUSINESS JETS<br />
CITATION CJ3 & CJ4<br />
PERFORMANCE<br />
Max Range<br />
Max Speed<br />
Typ. Passengers<br />
Cit. CJ3<br />
1,891 N.M. / 3,502 km<br />
Mach 0.73<br />
6<br />
Cit. CJ4<br />
1,991 N.M. / 3,687 km<br />
Mach 0.77<br />
7<br />
SUPPLY<br />
No. for Sale<br />
Avg Asking Price<br />
Avg Days on Market<br />
Mar<br />
5 (0.8%)<br />
6.2M USD<br />
219<br />
Dec<br />
8 (1.3%)<br />
6.1M USD<br />
259<br />
Mar<br />
7 (2.2%)<br />
7.4M USD<br />
47<br />
Dec<br />
8 (1.4%)<br />
7.8M USD<br />
68<br />
TRANSACTION<br />
Past 12 Months<br />
Past 3 Months<br />
Mar<br />
80<br />
12<br />
Dec<br />
68<br />
30<br />
Mar<br />
39<br />
8<br />
Dec<br />
37<br />
16<br />
Average Asking Price<br />
CJ4<br />
Market Indicators (vs. Last Quarter)<br />
CJ3<br />
$6.3M<br />
$4.0M<br />
$5.6M<br />
$4.3M<br />
$5.1M<br />
$4.3M<br />
Average<br />
$6.9M $6.9M $7.8M<br />
$4.5M $6.0M<br />
$5.2M<br />
$7.4M<br />
$6.2M<br />
Cit. CJ3<br />
Transaction Level (Past 12 Months)<br />
Inventory Level<br />
Average Asking Price<br />
Average Days on Market<br />
For Sale vs. Sold<br />
Sold For Sale<br />
6 4 4<br />
2 9 9<br />
3<br />
16<br />
8<br />
11<br />
6 15<br />
5 7<br />
6<br />
20<br />
5 5<br />
5 2 7<br />
5 4 6<br />
3<br />
69 74 74 81 76 72 73 63 60 52 37 34 34 32 26 25 24 17 20 19 17 16 8 8 12<br />
Mar May Jul Sep Nov Jan Mar May Jul Sep Nov Jan Mar<br />
2020 2021 <strong>2022</strong><br />
Cit. CJ4<br />
Transaction Level (Past 12 Months)<br />
Inventory Level<br />
Average Asking Price<br />
Average Days on Market<br />
Source: AMSTAT & ASG<br />
80 | ASIAN SKY QUARTERLY — FIRST QUARTER <strong>2022</strong>
MARKET SUMMARY: BUSINESS JETS<br />
CITATION LATITUDE<br />
Average Asking Price<br />
Market Indicators (vs. Last Quarter)<br />
Transaction Level (Past 12 Months)<br />
$13.4M<br />
$12.0M<br />
$13.5M<br />
$13.5M<br />
$11.5M<br />
$11.5M<br />
Inventory Level<br />
Average Asking Price<br />
Average Days on Market<br />
For Sale vs. Sold<br />
Sold<br />
For Sale<br />
2<br />
1 1 1<br />
3<br />
1<br />
1<br />
5 5 5 6 6 6 6 7 7 7 6 7 6 3 2 2 1 1 2 1 1 1 1<br />
Mar May Jul Sep Nov Jan Mar May Jul Sep Nov Jan Mar<br />
2020 2021 <strong>2022</strong><br />
1<br />
1<br />
1<br />
3<br />
PERFORMANCE<br />
Max Range<br />
Max Speed<br />
Typ. Passengers<br />
SUPPLY<br />
No. for Sale<br />
Avg Asking Price<br />
Avg Days on Market<br />
TRANSACTION<br />
Past 12 Months<br />
Past 3 Months<br />
2,870N.M. / 5,315 km<br />
Mach 0.80<br />
9<br />
Mar<br />
1 (0.3%)<br />
11.5M USD<br />
15<br />
Mar<br />
9<br />
1<br />
Dec<br />
1 (0.4%)<br />
11.5M USD<br />
51<br />
Dec<br />
8<br />
5<br />
CITATION SOVEREIGN<br />
Average Asking Price<br />
Market Indicators (vs. Last Quarter)<br />
$6.9M<br />
$6.8M<br />
$7.4M<br />
$5.7M<br />
$6.4M<br />
$7.2M<br />
$8.0M<br />
Transaction Level (Past 12 Months)<br />
Inventory Level<br />
Average Asking Price<br />
Average Days on Market<br />
For Sale vs. Sold<br />
3<br />
Sold<br />
1<br />
1<br />
For Sale<br />
1<br />
1<br />
3 6<br />
1 4<br />
10<br />
1<br />
3<br />
1<br />
2<br />
2<br />
27 29 30 32 36 36 38 33 35 33 24 21 24 23 21 20 17 16 14 12 10 8 4 3 4<br />
Mar May Jul Sep Nov Jan Mar May Jul Sep Nov Jan Mar<br />
4<br />
4<br />
2<br />
1 3<br />
1<br />
1 3<br />
2020 2021 <strong>2022</strong><br />
7<br />
PERFORMANCE<br />
Max Range<br />
Max Speed<br />
Typ. Passengers<br />
SUPPLY<br />
No. for Sale<br />
Avg Asking Price<br />
Avg Days on on Market<br />
TRANSACTION<br />
Past 12 Months<br />
Past 3 Months<br />
3,010N.M. / 5,574 km<br />
Mach 0.80<br />
9<br />
Mar<br />
4(0.9%)<br />
8.0M USD<br />
186<br />
Mar<br />
39<br />
5<br />
Dec<br />
8 (4.5%)<br />
3.1M USD<br />
176<br />
Dec<br />
34<br />
17<br />
Source: AMSTAT & ASG<br />
FIRST QUARTER <strong>2022</strong> — ASIAN SKY QUARTERLY | 81
MARKET SUMMARY: BUSINESS JETS<br />
FALCON 900DX/EX/EX EASY/LX<br />
PERFORMANCE<br />
Max Range<br />
Max Speed<br />
Typ. Passengers<br />
F900DX<br />
4,100 N.M. / 7,593 km<br />
Mach 0.83<br />
12<br />
F900EX<br />
4,500 N.M. / 8,334 km<br />
Mach 0.83<br />
12<br />
F900EX EASy<br />
4,500 N.M. / 8,334 km<br />
Mach 0.83<br />
12<br />
F900LX<br />
4,750 N.M. / 8,800 km<br />
Mach 0.83<br />
12<br />
SUPPLY<br />
No. for Sale<br />
Avg Asking Price<br />
Avg Days on Market<br />
Mar<br />
0 (0.0%)<br />
0.0M USD<br />
0<br />
Dec<br />
0 (0.0%)<br />
0.0M USD<br />
0<br />
Mar<br />
1 (0.8%)<br />
10.5M USD<br />
15<br />
Dec<br />
6 (5.1%)<br />
10.5M USD<br />
75<br />
Mar<br />
2 (1.7%)<br />
14.9M USD<br />
218<br />
Dec<br />
6 (5.0%)<br />
14.9M USD<br />
128<br />
Mar<br />
1 (1.2%)<br />
19.4M USD<br />
84<br />
Dec<br />
3 (3.7%)<br />
19.4M USD<br />
156<br />
TRANSACTION<br />
Past 12 Months<br />
Past 3 Months<br />
Mar<br />
2<br />
0<br />
Dec<br />
2<br />
1<br />
Mar<br />
17<br />
3<br />
Dec<br />
14<br />
7<br />
Mar<br />
8<br />
3<br />
Dec<br />
5<br />
2<br />
Mar<br />
7<br />
1<br />
Dec<br />
6<br />
2<br />
Average Asking Price<br />
F900EX EASy<br />
F900DX<br />
F900LX<br />
Average<br />
F900EX<br />
$21.0M $21.0M<br />
$19.5M<br />
$17.5M $17.5M<br />
$19.4M $19.4M<br />
$14.6M<br />
$14.9M<br />
$13.0M<br />
$14.7M<br />
$12.3M $12.3M<br />
$10.5M<br />
$14.9M<br />
$10.5M<br />
$12.7M $12.4M $12.3M $11.4M<br />
$10.3M<br />
$7.8M $7.8M $7.7M $7.5M $7.5M<br />
For Sale vs. Sold<br />
Sold For Sale<br />
1 1<br />
1 1 1 5 2 2 7<br />
3<br />
1<br />
2 2<br />
3 5 4<br />
1 1<br />
4 4<br />
2 1<br />
3<br />
4<br />
32 31 28 27 26 24 26 25 21 20 23 18 18 20 19 20 18 13 15 18 16 15 11 5 4<br />
Mar May Jul Sep Nov Jan Mar May Jul Sep Nov Jan Mar<br />
2020 2021 <strong>2022</strong><br />
Market Indicators (vs. Last Quarter)<br />
F900DX<br />
Transaction Level (Past 12 Months)<br />
Inventory Level<br />
Average Asking Price<br />
Average Days on Market<br />
F900EX<br />
Transaction Level (Past 12 Months)<br />
Inventory Level<br />
Average Asking Price<br />
Average Days on Market<br />
F900EX EASy<br />
Transaction Level (Past 12 Months)<br />
Inventory Level<br />
Average Asking Price<br />
Average Days on Market<br />
F900LX<br />
Transaction Level (Past 12 Months)<br />
Inventory Level<br />
Average Asking Price<br />
Average Days on Market<br />
Source: AMSTAT & ASG<br />
82 | ASIAN SKY QUARTERLY — FIRST QUARTER <strong>2022</strong>
MARKET SUMMARY: BUSINESS JETS<br />
FALCON 2000LX/LXS/S<br />
PERFORMANCE<br />
Max Range<br />
Max Speed<br />
Typ. Passengers<br />
F2000LX<br />
4,000 N.M. / 7,408 km<br />
Mach 0.83<br />
10<br />
F2000LXS<br />
4,000 N.M. / 7,408 km<br />
Mach 0.83<br />
10<br />
F2000S<br />
3,350 N.M. / 6,208 km<br />
Mach 0.83<br />
10<br />
SUPPLY<br />
No. for Sale<br />
Avg Asking Price<br />
Avg Days on Market<br />
Mar<br />
0 (0.0%)<br />
17.1M USD<br />
0<br />
Dec<br />
2 (1.5%)<br />
11.7M USD<br />
173<br />
Mar<br />
1 (0.9%)<br />
23.9M USD<br />
96<br />
Dec<br />
1 (0.9%)<br />
21.4M USD<br />
44<br />
Mar<br />
1 (2.1%)<br />
17.5M USD<br />
0<br />
Dec<br />
1 (2.2%)<br />
20.0M USD<br />
21<br />
TRANSACTION<br />
Past 12 Months<br />
Past 3 Months<br />
Mar<br />
10<br />
2<br />
Dec<br />
8<br />
4<br />
Mar<br />
13<br />
3<br />
Dec<br />
10<br />
5<br />
Mar<br />
1<br />
1<br />
Dec<br />
0<br />
0<br />
Average Asking Price<br />
$27.7M $27.7M $27.7M<br />
$21.8M $21.5M<br />
$19.0M<br />
$14.5M<br />
$12.0M<br />
$11.0M<br />
F2000S<br />
F2000LXS<br />
$27.7M $27.7M<br />
$21.4M<br />
$19.6M<br />
$9.1M $9.1M<br />
F2000LX<br />
Average<br />
$21.4M<br />
$20.0M<br />
$11.7M<br />
$23.9M<br />
$17.5M<br />
$17.1M<br />
Market Indicators (vs. Last Quarter)<br />
F2000LX<br />
Transaction Level (Past 12 Months)<br />
Inventory Level<br />
Average Asking Price<br />
Average Days on Market<br />
F2000LXS<br />
Transaction Level (Past 12 Months)<br />
For Sale vs. Sold<br />
Sold For Sale<br />
3<br />
Inventory Level<br />
Average Asking Price<br />
Average Days on Market<br />
1<br />
3<br />
3<br />
1 2<br />
1<br />
4<br />
15 16 16 17 15 15 15 20 16 15 13 8 13 11 10 10 6 4 4 4 5 4 2 1 2<br />
Mar May Jul Sep Nov Jan Mar May Jul Sep Nov Jan Mar<br />
2020 2021 <strong>2022</strong><br />
4<br />
3<br />
1<br />
1<br />
4<br />
6<br />
2<br />
2<br />
1<br />
F2000S<br />
Transaction Level (Past 12 Months)<br />
Inventory Level<br />
Average Asking Price<br />
Average Days on Market<br />
Source: AMSTAT & ASG<br />
FIRST QUARTER <strong>2022</strong> — ASIAN SKY QUARTERLY | 83
MARKET SUMMARY: BUSINESS JETS<br />
FALCON 7X<br />
Average Asking Price<br />
Market Indicators (vs. Last Quarter)<br />
$23.3M<br />
$19.9M<br />
$20.4M<br />
$21.8M<br />
$20.6M<br />
$23.5M<br />
Transaction Level (Past 12 Months)<br />
Inventory Level<br />
Average Asking Price<br />
Average Days on Market<br />
For Sale vs. Sold<br />
$24.4M<br />
PERFORMANCE<br />
Max Range<br />
Max Speed<br />
Typ. Passengers<br />
5,950 N.M. / 11,018 km<br />
Mach 0.90<br />
12<br />
Sold For Sale<br />
6<br />
2 1<br />
5<br />
2<br />
3<br />
1 1<br />
1 1<br />
1<br />
1<br />
1 1<br />
4<br />
3 5<br />
1 3 1<br />
20 24 26 15 19 20 19 20 24 19 13 15 17 18 17 19 15 14 14 9 6 5 3 1 1<br />
Mar May Jul Sep Nov Jan Mar May Jul Sep Nov Jan Mar<br />
2020 2021 <strong>2022</strong><br />
SUPPLY<br />
No. for Sale<br />
Avg Asking Price<br />
Avg Days on Market<br />
TRANSACTION<br />
Past 12 Months<br />
Past 3 Months<br />
Mar<br />
1 (0.3%)<br />
24.4M USD<br />
42<br />
Mar<br />
24<br />
5<br />
Dec<br />
5 (1.7%)<br />
21.5M USD<br />
166<br />
Dec<br />
19<br />
12<br />
Source: AMSTAT & ASG<br />
THE MOST<br />
COMPREHENSIVE<br />
BUSINESS<br />
AVIATION<br />
MARKET<br />
INTELLIGENCE<br />
FOR THE ASIA PACIFIC REGION<br />
Industry decision-makers use <strong>Asian</strong><br />
<strong>Sky</strong> Media’s analysis and data to<br />
drive their business strategy<br />
www.asianskymedia.com<br />
Contact us at media@asianskygroup.com to learn about our marketing solutions<br />
84 | ASIAN SKY QUARTERLY — FIRST QUARTER <strong>2022</strong>
MARKET SUMMARY: BUSINESS JETS<br />
PHENOM 300<br />
Average Asking Price<br />
Market Indicators (vs. Last Quarter)<br />
$8.2M<br />
Transaction Level (Past 12 Months)<br />
$6.6M<br />
$6.8M<br />
$6.6M<br />
$7.1M<br />
$7.0M<br />
$6.8M<br />
Inventory Level<br />
Average Asking Price<br />
Average Days on Market<br />
For Sale vs. Sold<br />
Sold For Sale<br />
2 4<br />
4 4 4<br />
2<br />
1<br />
1<br />
4 6<br />
6<br />
2<br />
3<br />
1<br />
5<br />
4 5<br />
4 4<br />
2 2<br />
28 33 35 36 38 35 38 42 41 38 36 31 28 30 25 24 23 15 15 8 7 7 3 2 5<br />
Mar May Jul Sep Nov Jan Mar May Jul Sep Nov Jan Mar<br />
2020 2021 <strong>2022</strong><br />
PERFORMANCE<br />
Max Range<br />
Max Speed<br />
Typ. Passengers<br />
SUPPLY<br />
No. for Sale<br />
Avg Asking Price<br />
Avg Days on Market<br />
TRANSACTION<br />
Past 12 Months<br />
Past 3 Months<br />
1,242 N.M. / 2,300 km<br />
Mach 0.78<br />
5<br />
Mar<br />
5 (0.8%)<br />
8.2M USD<br />
350<br />
Mar<br />
36<br />
4<br />
Dec<br />
7 (1.1%)<br />
6.8M USD<br />
350<br />
Dec<br />
32<br />
8<br />
LEGACY 600/650<br />
Average Asking Price<br />
L650<br />
Market Indicators (vs. Last Quarter)<br />
$15.0M<br />
$15.0M<br />
$13.1M<br />
$12.3M<br />
L600<br />
Average<br />
$13.5M<br />
$15.5M<br />
$13.5M<br />
Transaction Level (Past 12 Months)<br />
Inventory Level<br />
Average Asking Price<br />
L600<br />
L650<br />
Average Days on Market<br />
$9.2M<br />
Sold<br />
For Sale<br />
$8.1M<br />
For Sale vs. Sold<br />
2 1<br />
3<br />
2<br />
5<br />
$7.0M $7.2M $7.6<br />
2<br />
1 1<br />
1 3<br />
22 24 21 19 17 15 15 17 17 16 18 17 18 15 15 15 11 12 10 10 9 8 4 4 4<br />
Mar May Jul Sep Nov Jan Mar May Jul Sep Nov Jan Mar<br />
2020 2021 <strong>2022</strong><br />
5<br />
5<br />
1<br />
1<br />
2<br />
1<br />
$7.4<br />
5<br />
2<br />
$9.5<br />
2<br />
PERFORMANCE<br />
Max Range<br />
Max Speed<br />
Typ. Passengers<br />
SUPPLY<br />
No. for Sale<br />
Avg Asking Price<br />
Avg Days on Market<br />
TRANSACTION<br />
Past 12 Months<br />
Past 3 Months<br />
L600<br />
3,400 N.M.<br />
6,297 km<br />
Mach 0.80<br />
13<br />
Mar | Dec<br />
2 | 5<br />
9.5M USD<br />
7.5M USD<br />
75 | 416<br />
Mar | Dec<br />
15 | 13<br />
2 | 3<br />
L650<br />
3,640 N.M.<br />
7,112 km<br />
Mach 0.80<br />
13<br />
Mar | Dec<br />
2 | 3<br />
13.5M USD<br />
13.5M USD<br />
395 | 348<br />
Mar | Dec<br />
8 | 6<br />
2 | 3<br />
Source: AMSTAT & ASG<br />
FIRST QUARTER <strong>2022</strong> — ASIAN SKY QUARTERLY | 85
MARKET SUMMARY: BUSINESS JETS<br />
LINEAGE 1000/E<br />
Average Asking Price<br />
Market Indicators (vs. Last Quarter)<br />
$19.1M<br />
$17.7M<br />
$17.7M<br />
$14.9M<br />
$14.9M<br />
$16.0M<br />
Transaction Level (Past 12 Months)<br />
Inventory Level<br />
Average Asking Price<br />
Average Days on Market<br />
$9.9M<br />
PERFORMANCE<br />
For Sale vs. Sold<br />
Max Range<br />
Max Speed<br />
Typ. Passengers<br />
4,400 N.M. / 8,149 km<br />
Mach 0.82<br />
19<br />
Sold<br />
For Sale<br />
1<br />
SUPPLY<br />
No. for Sale<br />
Avg Asking Price<br />
Avg Days on Market<br />
Mar<br />
2 (6.7%)<br />
16.0M USD<br />
1,293<br />
Dec<br />
2 (6.7%)<br />
14.9M USD<br />
1,203<br />
6<br />
6 5<br />
5<br />
4 4 4 4 4 4 4 4 3 4 4 4 2 2 2 2 2 2 2 2 2<br />
Mar May Jul Sep Nov Jan Mar May Jul Sep Nov Jan Mar<br />
2020 2021 <strong>2022</strong><br />
TRANSACTION<br />
Past 12 Months<br />
Past 3 Months<br />
Mar<br />
1<br />
0<br />
Dec<br />
1<br />
0<br />
Source: AMSTAT & ASG<br />
86 | ASIAN SKY QUARTERLY — FIRST QUARTER <strong>2022</strong>
MARKET SUMMARY: BUSINESS JETS<br />
G200<br />
Average Asking Price<br />
Market Indicators (vs. Last Quarter)<br />
Transaction Level (Past 12 Months)<br />
$4.2M<br />
$4.0M<br />
$3.7M<br />
$3.4M<br />
$4.6M<br />
Inventory Level<br />
Average Asking Price<br />
Average Days on Market<br />
$3.6M<br />
$3.4M<br />
For Sale vs. Sold<br />
Sold For Sale<br />
2<br />
3<br />
1<br />
4<br />
4<br />
3<br />
2<br />
4<br />
1<br />
1 2 2 2 1<br />
3<br />
4<br />
3 7<br />
1<br />
1<br />
21 25 26 31 27 24 21 20 21 18 19 19 19 18 19 19 22 19 18 12 10 7 7 8 9<br />
Mar May Jul Sep Nov Jan Mar May Jul Sep Nov Jan Mar<br />
2020 2021 <strong>2022</strong><br />
PERFORMANCE<br />
Max Range<br />
Max Speed<br />
Typ. Passengers<br />
SUPPLY<br />
No. for Sale<br />
Avg Asking Price<br />
Avg Days on Market<br />
TRANSACTION<br />
Past 12 Months<br />
Past 3 Months<br />
3,050 N.M. / 5,651 km<br />
Mach 0.81<br />
8<br />
Mar<br />
9 (3.8%)<br />
4.6M USD<br />
229<br />
Mar<br />
29<br />
2<br />
Dec<br />
7 (2.9%)<br />
3.7M USD<br />
520<br />
Dec<br />
27<br />
14<br />
G280<br />
Average Asking Price<br />
Market Indicators (vs. Last Quarter)<br />
$18.5M<br />
$18.5M<br />
Transaction Level (Past 12 Months)<br />
Inventory Level<br />
$14.2M<br />
Average Asking Price<br />
Average Days on Market<br />
$12.5M<br />
Sold<br />
For Sale<br />
$13.0M<br />
For Sale vs. Sold<br />
13 14 15<br />
15<br />
2<br />
1<br />
5<br />
$11.7M<br />
1<br />
3<br />
$12.3M<br />
15 13 15 15 15 16 10 13 12 12 9 8 10 10 9 8 7 6 5 5 2<br />
Mar May Jul Sep Nov Jan Mar May Jul Sep Nov Jan Mar<br />
2020 2021 <strong>2022</strong><br />
1<br />
2<br />
2<br />
3<br />
3<br />
1<br />
5<br />
2<br />
1<br />
PERFORMANCE<br />
Max Range<br />
Max Speed<br />
Typ. Passengers<br />
SUPPLY<br />
No. for Sale<br />
Avg Asking Price<br />
Avg Days on Market<br />
TRANSACTION<br />
Past 12 Months<br />
Past 3 Months<br />
3,600 N.M. / 6,667 km<br />
Mach 0.84<br />
8<br />
Mar<br />
Dec<br />
2 (0.9%) 6 (2.7%)<br />
18.5M USD 18.5M USD<br />
124 164<br />
Mar<br />
23<br />
3<br />
Dec<br />
20<br />
9<br />
Source: AMSTAT & ASG<br />
FIRST QUARTER <strong>2022</strong> — ASIAN SKY QUARTERLY | 87
MARKET SUMMARY: BUSINESS JETS<br />
G450<br />
Average Asking Price<br />
Market Indicators (vs. Last Quarter)<br />
$14.2M<br />
Transaction Level (Past 12 Months)<br />
Inventory Level<br />
$13.6M<br />
$12.5M<br />
$13.0M<br />
Average Asking Price<br />
Average Days on Market<br />
$12.5M<br />
$12.1M<br />
$11.9M<br />
For Sale vs. Sold<br />
Sold For Sale<br />
3<br />
1<br />
1<br />
3<br />
7 3 4 5<br />
3<br />
1<br />
3 2 1 4<br />
5<br />
2 3<br />
2 2 1 5 8<br />
2<br />
1 2<br />
29 31 29 28 30 28 29 30 27 27 32 32 34 31 25 25 24 18 19 19 15 11 6 6 6<br />
Mar May Jul Sep Nov Jan Mar May Jul Sep Nov Jan Mar<br />
2020 2021 <strong>2022</strong><br />
PERFORMANCE<br />
Max Range<br />
Max Speed<br />
Typ. Passengers<br />
SUPPLY<br />
No. for Sale<br />
Avg Asking Price<br />
Avg Days on Market<br />
TRANSACTION<br />
Past 12 Months<br />
Past 3 Months<br />
4,350 N.M. / 8,056 km<br />
Mach 0.85<br />
13<br />
Mar<br />
6 (1.7%)<br />
13.0M USD<br />
259<br />
Mar<br />
38<br />
5<br />
Dec<br />
11 (3.1%)<br />
12.6M USD<br />
520<br />
Dec<br />
33<br />
14<br />
G550<br />
Average Asking Price<br />
Market Indicators (vs. Last Quarter)<br />
$20.2M<br />
Sold<br />
For Sale<br />
$18.3M<br />
For Sale vs. Sold<br />
2<br />
2 1 1<br />
3 4 5<br />
4<br />
$19.1M<br />
6<br />
13<br />
2<br />
1<br />
$16.1M<br />
$19.5M<br />
$21.2M<br />
$28.0M<br />
41 44 45 45 45 44 44 46 43 32 26 28 30 43 47 42 31 30 30 20 24 23 8 8 7<br />
Mar May Jul Sep Nov Jan Mar May Jul Sep Nov Jan Mar<br />
2020 2021 <strong>2022</strong><br />
3<br />
5<br />
5<br />
6<br />
8<br />
3<br />
7<br />
7<br />
3<br />
20<br />
5<br />
2<br />
5<br />
PERFORMANCE<br />
Max Range<br />
Max Speed<br />
Typ. Passengers<br />
SUPPLY<br />
No. for Sale<br />
Avg Asking Price<br />
Avg Days on Market<br />
TRANSACTION<br />
Past 12 Months<br />
Past 3 Months<br />
Transaction Level (Past 12 Months)<br />
Inventory Level<br />
Average Asking Price<br />
Average Days on Market<br />
6,750 N.M. / 12,501 km<br />
Mach 0.87<br />
18<br />
Mar<br />
7 (1.1%)<br />
28.0M USD<br />
47<br />
Mar<br />
76<br />
12<br />
Dec<br />
23 (3.8%)<br />
21.2M USD<br />
133<br />
Dec<br />
64<br />
30<br />
Source: AMSTAT & ASG<br />
88 | ASIAN SKY QUARTERLY — FIRST QUARTER <strong>2022</strong>
MARKET SUMMARY: BUSINESS JETS<br />
G650 & G650 ER<br />
Average Asking Price<br />
$49.2M<br />
$41.0M<br />
$45.2M<br />
$37.1M<br />
For Sale vs. Sold<br />
2<br />
13<br />
Sold<br />
2<br />
16 14<br />
For Sale<br />
17<br />
6<br />
2<br />
2<br />
20 20 23<br />
$42.0M<br />
$39.0M<br />
6<br />
16<br />
24 21 14<br />
5<br />
$40.2M<br />
$30.2M<br />
1<br />
3<br />
G650ER<br />
G650<br />
Average<br />
2<br />
$42.8M<br />
$39.2M<br />
$49.1M<br />
$39.2M<br />
$52.7M<br />
$49.0M<br />
13 12 12 12 12 15 16 15 13 10 5 7 9 9 11<br />
Mar May Jul Sep Nov Jan Mar May Jul Sep Nov Jan Mar<br />
2020 2021 <strong>2022</strong><br />
2<br />
1<br />
1<br />
5<br />
3<br />
1<br />
2<br />
5<br />
1<br />
1<br />
ASIAN SKY CONSULTING<br />
Independent Business and General Aviation Consulting Services<br />
01<br />
02<br />
03<br />
04<br />
Market Indicators (vs. Last Quarter)<br />
Transaction Level (Past 12 Months)<br />
Inventory Level<br />
Average Asking Price<br />
Average Days on Market<br />
PERFORMANCE<br />
Max Range<br />
Max Speed<br />
Typ. Passengers<br />
SUPPLY<br />
No. for Sale<br />
Avg Asking Price<br />
Avg Days on Market<br />
TRANSACTION<br />
Past 12 Months<br />
Past 3 Months<br />
TRANSACTIONAL ADVISORY<br />
Manage the engagement, drafting, review and<br />
negotiation of any aviation transactional<br />
documents, liaise, control and lead the transaction<br />
process to ensure the best terms and successful<br />
results are achieved.<br />
OPERATION ADVISORY<br />
Perform operational analysis, management selection<br />
and due diligence, recommend operational and<br />
aircraft ownership structure advisory.<br />
MARKET RESEARCH & STUDIES<br />
Perform aviation market research, appraisals,<br />
feasibility studies and aviation business planning.<br />
COMPLETION MANAGEMENT<br />
G650<br />
7,000 N.M.<br />
12,964 km<br />
Mach 0.90<br />
18<br />
Mar | Dec<br />
4 | 2<br />
49.0M USD<br />
41.1M USD<br />
94 | 61<br />
Mar | Dec<br />
7 | 6<br />
1 | 2<br />
G650<br />
Generate corporate airliner cabin definition, select the<br />
most suitable completion facility, handle green aircraft<br />
delivery, carry out completion oversight and conduct<br />
aircraft final delivery & compliance inspections.<br />
G650ER<br />
7,500 N.M.<br />
13,890 km<br />
Mach 0.90<br />
18<br />
Mar | Dec<br />
7 | 5<br />
52.7M USD<br />
50.1M USD<br />
17 | 11<br />
Mar | Dec<br />
17 | 11<br />
6 | 4<br />
G650ER<br />
Source: AMSTAT & ASG<br />
Please contact our sales team for more information<br />
Email: sales@asianskygroup.com<br />
Website: www.asianskygroup.com<br />
FIRST QUARTER <strong>2022</strong> — ASIAN SKY QUARTERLY | 89
MARKET<br />
SUMMARY<br />
CIVIL HELICOPTERS<br />
<strong>2022</strong> <strong>Q1</strong><br />
90 | ASIAN SKY QUARTERLY — FIRST QUARTER <strong>2022</strong>
AIRCRAFT POSITIONING<br />
ACQUISITION COST VS. MAX RANGE<br />
AIRCRAFT ACQUISITION PRICE (MILLION USD)<br />
AIRCRAFT ACQUISITION PRICE (MILLION USD)<br />
6<br />
5<br />
4<br />
3<br />
2<br />
1<br />
0<br />
8<br />
4<br />
2<br />
1<br />
0.5<br />
0.25<br />
1000<br />
HEAVY<br />
(SUPER) MEDIUM<br />
LIGHT TWIN<br />
SINGLE TURBINE<br />
PISTON<br />
HEAVY<br />
(SUPER) MEDIUM<br />
LIGHT TWIN<br />
SINGLE TURBINE<br />
PISTON<br />
ACQUISITION COST VS. CABIN VOLUME<br />
AIRCRAFT ACQUISITION PRICE (MILLION USD)<br />
8<br />
4<br />
2<br />
1<br />
0.5<br />
0.25<br />
20<br />
100<br />
HEAVY<br />
(SUPER) MEDIUM<br />
LIGHT TWIN<br />
SINGLE TURBINE<br />
PISTON<br />
EN480B<br />
S-76D<br />
H155<br />
BELL 412EPI<br />
AW139<br />
S-76C++<br />
H135(T3)<br />
H145<br />
BELL 430<br />
AW169<br />
MD902<br />
BELL 429<br />
AW109 GRANDNEW<br />
AW109 POWER<br />
MD530F BELL 206L4<br />
BELL 407GXP H125<br />
AW119KX<br />
MD502N<br />
H130<br />
MD600N<br />
H120<br />
MD550E R66<br />
BELL 505<br />
R22 BETA II<br />
R44 RAVEN II<br />
EN480B BELL 407<br />
R44 RAVEN II<br />
R22 BETA II<br />
2000<br />
MD 520N<br />
MD 530F<br />
R44 RAVEN II<br />
R22 BETA II<br />
40<br />
MD500E<br />
EN480B<br />
R66<br />
MD 500E<br />
R66<br />
200 300 400<br />
500<br />
600 700<br />
MAXIMUM RANGE (N.M)<br />
80<br />
H225<br />
MD 902<br />
H135(T3)<br />
AW109 POWER<br />
BELL 407GXP<br />
MD 600N<br />
BELL 505<br />
H215(C1)<br />
ACQUISITION COST VS. MAX TAKEOFF WEIGHT<br />
MD520N<br />
MD530F<br />
H120<br />
4000<br />
8000<br />
MAX TAKE-OFF WEIGHT (LBS)<br />
BELL430<br />
H145<br />
MD 902<br />
H135(T3)<br />
H125<br />
BELL 407GXP<br />
H130 MD 600N<br />
H120<br />
BELL 407<br />
BELL 206L4<br />
BELL 505<br />
BELL429<br />
AW109 POWER<br />
AW119KX<br />
160<br />
CABIN VOLUMN (CU.FT)<br />
S-92<br />
S-76D<br />
16000<br />
H175<br />
H155<br />
AW139<br />
AW169<br />
BELL412EPI<br />
AW109 GRANDNEW<br />
S-76C++<br />
AW189<br />
S-92<br />
H225<br />
H155<br />
H215(C1)<br />
H145<br />
S-76D<br />
AW189<br />
AW169<br />
H175<br />
AW139<br />
BELL 429<br />
BELL 412EPI S-76C++<br />
BELL 430<br />
AW109 GRANDNEW<br />
AW119KX<br />
H130<br />
H125 BELL 407 BELL 206L4<br />
MARKET SUMMARY: CIVIL HELICOPTERS<br />
H215(C1) S-92<br />
H175<br />
AW189<br />
32000<br />
H225<br />
320 640 800<br />
Source: Conklin & de Decker<br />
FIRST QUARTER <strong>2022</strong> — ASIAN SKY QUARTERLY | 91
MARKET SUMMARY: CIVIL HELICOPTERS<br />
MARKET SUMMARY PER MODEL<br />
INVENTORY LEVEL, PRICE TREND & TRANSACTIONS<br />
H125<br />
Average Asking Price<br />
Market Indicators (vs. Last Quarter)<br />
Transaction Level (Past 12 Months)<br />
$2.4M<br />
$2.4M<br />
$2.4M<br />
$2.4M<br />
$2.3M<br />
$2.4M<br />
$2.5M<br />
Inventory Level<br />
Average Asking Price<br />
Average Days on Market<br />
For Sale vs. Sold<br />
Sold<br />
3<br />
3<br />
3<br />
26 24 26<br />
For Sale<br />
2 2<br />
26<br />
4<br />
26 28<br />
2<br />
25<br />
3<br />
26 26 27<br />
2<br />
1<br />
3 6<br />
5<br />
4<br />
1<br />
2<br />
31 36 38 25 24 24 15 14 15 15 19 18 19 20 19<br />
1<br />
6<br />
3<br />
7 4 3<br />
Mar May Jul Sep Nov Jan Mar May Jul Sep Nov Jan Mar<br />
2020 2021 <strong>2022</strong><br />
1<br />
PERFORMANCE<br />
Max Range<br />
Max Speed<br />
Typ. Passengers<br />
SUPPLY<br />
No. for Sale<br />
Avg Asking Price<br />
Avg Days on Market<br />
TRANSACTION<br />
Past 12 Months<br />
Past 3 Months<br />
340 N.M. / 630 km<br />
140 Knots<br />
6<br />
Mar<br />
19 (1.9%)<br />
2.5M USD<br />
279<br />
Mar<br />
43<br />
8<br />
Dec<br />
18 (1.9%)<br />
2.4M USD<br />
339<br />
Dec<br />
35<br />
16<br />
H130<br />
Average Asking Price<br />
Market Indicators (vs. Last Quarter)<br />
$3.1M<br />
$2.7M<br />
$2.8M<br />
$2.9M<br />
$2.5M<br />
Transaction Level (Past 12 Months)<br />
Inventory Level<br />
Average Asking Price<br />
$2.5M<br />
Average Days on Market<br />
$2.0M<br />
Sold For Sale<br />
4<br />
2 3<br />
4<br />
1<br />
1<br />
1<br />
1<br />
1<br />
2<br />
2<br />
5<br />
2<br />
5<br />
1<br />
1 2<br />
3<br />
For Sale vs. Sold<br />
7 8 11 11 12 14 16 16 15 15 12 10 9 8 7 5 5 5 5 5 5 4 4 4 7<br />
Mar May Jul Sep Nov Jan Mar May Jul Sep Nov Jan Mar<br />
2020 2021 <strong>2022</strong><br />
PERFORMANCE<br />
Max Range<br />
Max Speed<br />
Typ. Passengers<br />
SUPPLY<br />
No. for Sale<br />
Avg Asking Price<br />
Avg Days on Market<br />
TRANSACTION<br />
Past 12 Months<br />
Past 3 Months<br />
333 N.M. / 606km<br />
128 Knots<br />
7<br />
Mar<br />
7 (2.2%)<br />
2.0M USD<br />
216<br />
Mar<br />
21<br />
1<br />
Dec<br />
4 (1.3%)<br />
2.0M USD<br />
325<br />
Dec<br />
20<br />
8<br />
Source: AMSTAT & ASG<br />
92 | ASIAN SKY QUARTERLY — FIRST QUARTER <strong>2022</strong>
MARKET SUMMARY: CIVIL HELICOPTERS<br />
EC135P2 & T2<br />
Average Asking Price<br />
$2.5M<br />
$2.2M<br />
$2.2M<br />
$2.0M<br />
$2.4M<br />
EC135T2<br />
EC135P2<br />
Average<br />
Market Indicators (vs. Last Quarter)<br />
Transaction Level (Past 12 Months)<br />
Inventory Level<br />
Average Asking Price<br />
EC135P2 EC135T2<br />
$1.7M<br />
$1.7M<br />
Average Days on Market<br />
$1.7M $1.7M<br />
For Sale vs. Sold<br />
Sold For Sale<br />
$1.7M<br />
$1.7M<br />
$1.7M<br />
$1.7M<br />
$1.7M<br />
PERFORMANCE<br />
Max Range<br />
Max Speed<br />
Typ. Passengers<br />
EC135P2<br />
332 N.M.<br />
614 km<br />
127 Knots<br />
6<br />
EC135T2<br />
332 N.M.<br />
614 km<br />
127 Knots<br />
6<br />
1<br />
1 1<br />
2 2<br />
1 2<br />
1 1 1<br />
1<br />
1<br />
SUPPLY<br />
No. for Sale<br />
Avg Asking Price<br />
Avg Days on Market<br />
Mar | Dec<br />
7 | 6<br />
1.7M USD<br />
1.7M USD<br />
390 | 360<br />
Mar | Dec<br />
3 | 3<br />
1.7M USD<br />
1.7M USD<br />
127 | 206<br />
9 9 8 8 7 8 8 7 7 7 10 9 9 8 8 8 5 5 5 8 8 9 9 10 10<br />
Mar May Jul Sep Nov Jan Mar May Jul Sep Nov Jan Mar<br />
2020 2021 <strong>2022</strong><br />
TRANSACTION<br />
Past 12 Months<br />
Past 3 Months<br />
Mar | Dec<br />
5 | 4<br />
1 | 2<br />
Mar | Dec<br />
0 | 0<br />
0 | 0<br />
EC145<br />
Average Asking Price<br />
Market Indicators (vs. Last Quarter)<br />
$4.3M<br />
$3.9M<br />
$3.7M<br />
Transaction Level (Past 12 Months)<br />
Inventory Level<br />
$3.1M<br />
$3.1M<br />
Average Asking Price<br />
Average Days on Market<br />
$2.9M<br />
For Sale vs. Sold<br />
Sold<br />
For Sale<br />
$2.4M<br />
PERFORMANCE<br />
Max Range<br />
Max Speed<br />
Typ. Passengers<br />
461 N.M. / 855 km<br />
131 Knots<br />
9<br />
3<br />
2<br />
1<br />
1<br />
1<br />
2<br />
2<br />
1<br />
1<br />
2<br />
1<br />
2<br />
1<br />
5<br />
2<br />
SUPPLY<br />
No. for Sale<br />
Avg Asking Price<br />
Avg Days on Market<br />
Mar<br />
9 (1.2%)<br />
3.1M USD<br />
240<br />
Dec<br />
9 (1.2%)<br />
3.1M USD<br />
367<br />
9 9 10<br />
10<br />
9 10 9 9 7 7 7 6 7 7 8 8 7 5 5 5 9 9 10 10 9<br />
Mar May Jul Sep Nov Jan Mar May Jul Sep Nov Jan Mar<br />
2020 2021 <strong>2022</strong><br />
TRANSACTION<br />
Past 12 Months<br />
Past 3 Months<br />
Mar<br />
13<br />
2<br />
Dec<br />
11<br />
6<br />
Source: AMSTAT & ASG<br />
FIRST QUARTER <strong>2022</strong> — ASIAN SKY QUARTERLY | 93
MARKET SUMMARY: CIVIL HELICOPTERS<br />
H155 & EC155B<br />
Average Asking Price<br />
Market Indicators (vs. Last Quarter)<br />
EC155B<br />
H155<br />
Average<br />
H155<br />
Transaction Level (Past 12 Months)<br />
EC155B<br />
$3.9M<br />
$2.9M<br />
$3.9M<br />
$3.8M<br />
$3.5M<br />
$3.2M<br />
$4.0M<br />
$3.6M<br />
Inventory Level<br />
Average Asking Price<br />
Average Days on Market<br />
$2.6M<br />
For Sale vs. Sold<br />
Sold For Sale<br />
$2.6M<br />
$2.6M<br />
$2.6M<br />
PERFORMANCE<br />
Max Range<br />
Max Speed<br />
Typ. Passengers<br />
H155<br />
516 N.M.<br />
955 km<br />
150 Knots<br />
13<br />
EC155B<br />
516 N.M.<br />
955 km<br />
135 Knots<br />
13<br />
1<br />
1<br />
1<br />
1<br />
1<br />
1<br />
3<br />
3<br />
3<br />
1<br />
SUPPLY<br />
No. for Sale<br />
Avg Asking Price<br />
Avg Days on Market<br />
Mar | Dec<br />
10 | 8<br />
3.6M USD<br />
3.7M USD<br />
805 | 931<br />
Mar | Dec<br />
0 | 0<br />
0.0M USD<br />
0.0M USD<br />
0 | 0<br />
16 16 16 16 16 17<br />
16<br />
15 12<br />
11<br />
11 10 10 10 12 11 12 13 12 10 8 8 9 10 10<br />
Mar May Jul Sep Nov Jan Mar May Jul Sep Nov Jan Mar<br />
2020 2021 <strong>2022</strong><br />
TRANSACTION<br />
Past 12 Months<br />
Past 3 Months<br />
Mar | Dec<br />
14 | 10<br />
4 | 3<br />
Mar | Dec<br />
2 | 2<br />
0 | 0<br />
H225<br />
Average Asking Price<br />
$9.0M<br />
Market Indicators (vs. Last Quarter)<br />
Transaction Level (Past 12 Months)<br />
Inventory Level<br />
Average Asking Price<br />
$6.2M<br />
$6.2M<br />
Average Days on Market<br />
$5.5M<br />
$5.0M<br />
For Sale vs. Sold<br />
Sold<br />
For Sale<br />
$3.9M<br />
$3.8M<br />
PERFORMANCE<br />
Max Range<br />
Max Speed<br />
Typ. Passengers<br />
452 N.M. / 837 km<br />
142 Knots<br />
19<br />
6<br />
1<br />
1<br />
10<br />
1 2 2<br />
1 1<br />
SUPPLY<br />
No. for Sale<br />
Avg Asking Price<br />
Avg Days onMarket<br />
Mar<br />
10 (5.6%)<br />
3.8M USD<br />
626<br />
Dec<br />
11 (6.1%)<br />
3.9M USD<br />
752<br />
9<br />
11 10<br />
9<br />
8 9<br />
9<br />
9 11<br />
11 11 11 11 12 12 12 11 11 11 11 11 11 11 13 10<br />
Mar May Jul Sep Nov Jan Mar May Jul Sep Nov Jan Mar<br />
TRANSACTION<br />
Past 12 Months<br />
Past 3 Months<br />
Mar<br />
17<br />
2<br />
Dec<br />
15<br />
2<br />
2020 2021 <strong>2022</strong><br />
Source: AMSTAT & ASG<br />
94 | ASIAN SKY QUARTERLY — FIRST QUARTER <strong>2022</strong>
MARKET SUMMARY: CIVIL HELICOPTERS<br />
BELL 206 JETRANGER / LONGRANGER<br />
Average Asking Price<br />
$0.9M<br />
$0.9M<br />
$0.8M<br />
$0.8M<br />
$0.9M<br />
Bell 206 LongRanger<br />
Bell 206 JetRanger<br />
Average<br />
$0.8M<br />
$0.9M<br />
Market Indicators (vs. Last Quarter)<br />
Transaction Level (Past 12 Months)<br />
Inventory Level<br />
Average Asking Price<br />
Bell 206J Bell 206L<br />
$0.5M<br />
$0.5M<br />
For Sale vs. Sold<br />
Sold For Sale<br />
$0.5M<br />
$0.5M<br />
$0.5M<br />
$0.5M<br />
$0.6M<br />
Average Days on Market<br />
PERFORMANCE<br />
Max Range<br />
Max Speed<br />
Typ. Passengers<br />
Bell 206J<br />
374 N.M.<br />
693 km<br />
121 Knots<br />
4<br />
Bell 206L<br />
270 N.M.<br />
500 km<br />
105 Knots<br />
6<br />
9 12<br />
10<br />
5 2 7 11<br />
6 10<br />
3<br />
10<br />
12 15 17 16<br />
17<br />
13<br />
7 7 8<br />
14 18<br />
4<br />
17<br />
9<br />
SUPPLY<br />
No. for Sale<br />
Avg Asking Price<br />
Avg Days on Market<br />
Mar | Dec<br />
78 | 96<br />
0.6M USD<br />
0.5M USD<br />
745 | 713<br />
Mar | Dec<br />
40 | 47<br />
0.9M USD<br />
0.8M USD<br />
501 | 575<br />
205 203 203 202 201 201 200 221 222 215 197 205 195 197 197 184 175 169 162 161 154 143 140 138 118<br />
Mar May Jul Sep Nov Jan Mar May Jul Sep Nov Jan Mar<br />
TRANSACTION<br />
Past 12 Months<br />
Past 3 Months<br />
Mar | Dec<br />
137 | 107<br />
30 | 40<br />
Mar | Dec<br />
10 | 10<br />
0 | 0<br />
2020 2021 <strong>2022</strong><br />
BELL 407<br />
Average Asking Price<br />
Market Indicators (vs. Last Quarter)<br />
Transaction Level (Past 12 Months)<br />
$2.3M<br />
$2.4M<br />
$2.3M<br />
$2.2M<br />
$2.1M<br />
$2.2M<br />
$2.2M<br />
Inventory Level<br />
Average Asking Price<br />
Average Days on Market<br />
For Sale vs. Sold<br />
Sold<br />
3<br />
3<br />
7<br />
For Sale<br />
4<br />
1 2<br />
7<br />
2<br />
9<br />
7 4 3 3<br />
46 49 49 52 60 60 60 64 66 68 67 71 68 68 66 64 61 59 53 55 57 50 37 32 28<br />
Mar May Jul Sep Nov Jan Mar May Jul Sep Nov Jan Mar<br />
2020 2021 <strong>2022</strong><br />
11<br />
6<br />
4<br />
5<br />
2<br />
6<br />
9<br />
16<br />
6<br />
6<br />
4<br />
PERFORMANCE<br />
Max Range<br />
Max Speed<br />
Typ. Passengers<br />
SUPPLY<br />
No. for Sale<br />
Avg Asking Price<br />
Avg Days on Market<br />
TRANSACTION<br />
Past 12 Months<br />
Past 3 Months<br />
323 N.M. / 598 km<br />
132 Knots<br />
7<br />
Mar<br />
28 (1.7%)<br />
2.2M USD<br />
436<br />
Mar<br />
75<br />
16<br />
Dec<br />
50 (3.0%)<br />
2.2M USD<br />
483<br />
Dec<br />
59<br />
31<br />
Source: AMSTAT & ASG<br />
FIRST QUARTER <strong>2022</strong> — ASIAN SKY QUARTERLY | 95
MARKET SUMMARY: CIVIL HELICOPTERS<br />
BELL 412EP/412HP<br />
Average Asking Price<br />
Market Indicators (vs. Last Quarter)<br />
$3.5M<br />
$5.6M<br />
$3.3M<br />
Bell 412 HP<br />
Bell 412 EP<br />
Average<br />
$3.1M<br />
$4.7M<br />
$4.7M<br />
$5.4M<br />
Bell 412EP Bell 412HP<br />
Transaction Level (Past 12 Months)<br />
Inventory Level<br />
Average Asking Price<br />
Average Days on Market<br />
$2.0M<br />
$2.2M<br />
For Sale vs. Sold<br />
Sold For Sale<br />
$2.2M<br />
$2.2M<br />
$2.6M<br />
$2.6M<br />
$2.6M<br />
PERFORMANCE<br />
Max Range<br />
Max Speed<br />
Typ. Passengers<br />
Bell 412EP<br />
356 N.M. /<br />
659 km<br />
140 Knots<br />
9<br />
Bell 412HP<br />
349 N.M. /<br />
646 km<br />
133 Knots<br />
14<br />
3<br />
3 3<br />
1<br />
1<br />
1<br />
1<br />
8<br />
1<br />
2<br />
2<br />
3<br />
1<br />
5<br />
1<br />
SUPPLY<br />
No. for Sale<br />
Avg Asking Price<br />
Avg Days on Market<br />
Mar | Dec<br />
22 | 20<br />
5.4M USD<br />
4.7M USD<br />
361 | 481<br />
Mar | Dec<br />
1 | 1<br />
2.6M USD<br />
2.6M USD<br />
396 | 306<br />
27 23 23 23 23 27 27 29 29 30 31 29 29 23 22 21 23 24 24 22 22 21 20 22 23<br />
Mar May Jul Sep Nov Jan Mar May Jul Sep Nov Jan Mar<br />
TRANSACTION<br />
Past 12 Months<br />
Past 3 Months<br />
Mar | Dec<br />
15 | 16<br />
1 | 6<br />
Mar | Dec<br />
2 | 2<br />
0 | 0<br />
2020 2021 <strong>2022</strong><br />
BELL 429<br />
Average Asking Price<br />
Market Indicators (vs. Last Quarter)<br />
$4.4M<br />
Transaction Level (Past 12 Months)<br />
$4.2M<br />
Inventory Level<br />
$4.1M<br />
$4.1M<br />
$4.0M<br />
$4.2M<br />
$4.0M<br />
Average Asking Price<br />
Average Days on Market<br />
For Sale vs. Sold<br />
Sold For Sale<br />
2<br />
2<br />
2 1<br />
1<br />
2<br />
3<br />
1<br />
1 1<br />
1 1<br />
2<br />
4<br />
1<br />
2 1<br />
14 14 15 16 18 18 14 15 14 12 9 8 9 9 8 8 8 6 5 5 5 4 3 3 3<br />
Mar May Jul Sep Nov Jan Mar May Jul Sep Nov Jan Mar<br />
2020 2021 <strong>2022</strong><br />
PERFORMANCE<br />
Max Range<br />
Max Speed<br />
Typ. Passengers<br />
SUPPLY<br />
No. for Sale<br />
Avg Asking Price<br />
Avg Days on Market<br />
TRANSACTION<br />
Past 12 Months<br />
Past 3 Months<br />
368 N.M. / 681 km<br />
130 Knots<br />
7<br />
Mar<br />
3 (0.7%)<br />
4.0M USD<br />
457<br />
Mar<br />
13<br />
3<br />
Dec<br />
4 (1.0%)<br />
4.2M USD<br />
734<br />
Dec<br />
10<br />
5<br />
Source: AMSTAT & ASG<br />
96 | ASIAN SKY QUARTERLY — FIRST QUARTER <strong>2022</strong>
MARKET SUMMARY: CIVIL HELICOPTERS<br />
AW109SP GRANDNEW<br />
Average Asking Price<br />
Market Indicators (vs. Last Quarter)<br />
$4.5M<br />
$4.7M<br />
$4.6M<br />
$4.6M<br />
$4.5M<br />
$4.6M<br />
Transaction Level (Past 12 Months)<br />
Inventory Level<br />
Average Asking Price<br />
Average Days on Market<br />
$4.3M<br />
For Sale vs. Sold<br />
Sold For Sale<br />
PERFORMANCE<br />
Max Range<br />
Max Speed<br />
Typ. Passengers<br />
480 N.M. / 889 km<br />
130 Knots<br />
7<br />
1<br />
5<br />
1<br />
2<br />
3 2<br />
1<br />
1<br />
4<br />
1<br />
1 1<br />
2<br />
1<br />
12 15 17 17 16 18 19 22 22 19 15 16 14 13 15 14 10 8 7 7 6 6 10 10 9<br />
Mar May Jul Sep Nov Jan Mar May Jul Sep Nov Jan Mar<br />
2020 2021 <strong>2022</strong><br />
SUPPLY<br />
No. for Sale<br />
Avg Asking Price<br />
Avg Days on Market<br />
TRANSACTION<br />
Past 12 Months<br />
Past 3 Months<br />
Mar<br />
9 (4.4%)<br />
4.6M USD<br />
204<br />
Mar<br />
13<br />
2<br />
Dec<br />
6 (2.9%)<br />
4.5M USD<br />
212<br />
Dec<br />
11<br />
6<br />
AW139<br />
Average Asking Price<br />
Market Indicators (vs. Last Quarter)<br />
$6.8M<br />
$6.0M<br />
$5.7M<br />
$6.2M<br />
$5.9M<br />
Transaction Level (Past 12 Months)<br />
Inventory Level<br />
Average Asking Price<br />
Average Days on Market<br />
For Sale vs. Sold<br />
Sold<br />
For Sale<br />
$5.1M<br />
$5.3M<br />
PERFORMANCE<br />
Max Range<br />
Max Speed<br />
Typ. Passengers<br />
568 N.M. / 1,052 km<br />
140 Knots<br />
15<br />
6<br />
1<br />
1<br />
2<br />
4<br />
5<br />
3 2 3<br />
1 1 2<br />
4<br />
3<br />
1<br />
2<br />
4<br />
SUPPLY<br />
No. for Sale<br />
Avg Asking Price<br />
Avg Days on Market<br />
Mar<br />
20 (2.0%)<br />
5.3M USD<br />
503<br />
Dec<br />
30 (3.0%)<br />
5.1M USD<br />
453<br />
23 24 24 23 24 31 27 28 29 28 31 31 32 30 32 31 29 32 31 33 31 30 27 28 20<br />
Mar May Jul Sep Nov Jan Mar May Jul Sep Nov Jan Mar<br />
2020 2021 <strong>2022</strong><br />
TRANSACTION<br />
Past 12 Months<br />
Past 3 Months<br />
Mar<br />
29<br />
7<br />
Dec<br />
22<br />
8<br />
Source: AMSTAT & ASG<br />
FIRST QUARTER <strong>2022</strong> — ASIAN SKY QUARTERLY | 97
MARKET SUMMARY: CIVIL HELICOPTERS<br />
S-76C+ / S-76C++<br />
Average Asking Price<br />
Market Indicators (vs. Last Quarter)<br />
$4.8M<br />
$4.6M<br />
S76C+<br />
S76C++<br />
Average<br />
Transaction Level (Past 12 Months)<br />
Inventory Level<br />
S76C+<br />
S76C++<br />
$3.8M<br />
Average Asking Price<br />
$2.3M<br />
$2.5M<br />
$2.5M<br />
Average Days on Market<br />
$1.7M<br />
$1.7M<br />
For Sale vs. Sold<br />
Sold For Sale<br />
$1.6M<br />
$1.8M<br />
$2.1M<br />
$1.9M<br />
$1.9M<br />
$1.9M<br />
PERFORMANCE<br />
Max Range<br />
Max Speed<br />
Typ. Passengers<br />
S-76C+<br />
335 N.M. /<br />
620 km<br />
155 Knots<br />
12<br />
S-76C++<br />
335 N.M. /<br />
620 km<br />
155 Knots<br />
12<br />
1<br />
2<br />
5<br />
1<br />
1<br />
3<br />
1<br />
2<br />
SUPPLY<br />
No. for Sale<br />
Avg Asking Price<br />
Avg Days on Market<br />
Mar | Dec<br />
11 | 11<br />
1.9M USD<br />
1.9M USD<br />
1008 | 918<br />
Mar | Dec<br />
10 | 11<br />
1.9M USD<br />
2.5M USD<br />
713 | 794<br />
40 43 43 44 43 45 44 42 44 39 42 32 27 24 23 23 22 22 23 22 22 22 21 23 21<br />
Mar May Jul Sep Nov Jan Mar May Jul Sep Nov Jan Mar<br />
2020 2021 <strong>2022</strong><br />
FEATURED AIRCRAFT<br />
TRANSACTION<br />
Past 12 Months<br />
Past 3 Months<br />
Mar | Dec<br />
3 | 3<br />
0 | 0<br />
Mar | Dec<br />
10 | 8<br />
3 | 1<br />
Source: AMSTAT & ASG<br />
AIRBUS - EC135P2+ SN0682<br />
TOTAL HOURS: 3,425 HOURS SINCE NEW<br />
• 2+4 VIP configuration<br />
• Single pilot / dual pilot IFR<br />
• 3-Axis autopilot<br />
• Air comm air conditioning system<br />
• Safran aero emergency floats<br />
• Aero metals engine inlet barrier filter system<br />
• Outerlink flight data monitoring system<br />
• Weather radar fixed parts<br />
98 | ASIAN SKY QUARTERLY — FIRST QUARTER <strong>2022</strong>
FIRST QUARTER <strong>2022</strong> — ASIAN SKY QUARTERLY | 99
100 | ASIAN SKY QUARTERLY — FIRST QUARTER <strong>2022</strong>