CP klimarapport 2021 endelig_eng

You also want an ePaper? Increase the reach of your titles
YUMPU automatically turns print PDFs into web optimized ePapers that Google loves.
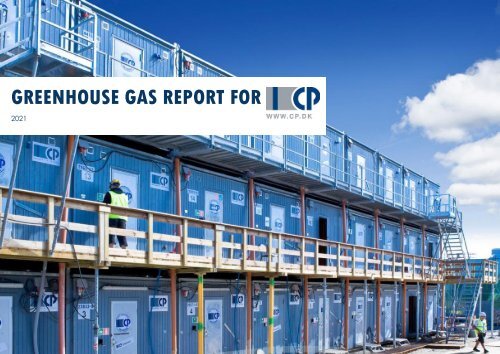
GREENHOUSE GAS REPORT FOR<br />
<strong>2021</strong><br />
page 1 of 23
BACKGROUND<br />
This greenhouse gas (GHG) report has been made in<br />
accordance with the guidelines in the International<br />
Accounting and Reporting Standard, GHG Protocol<br />
Corporate Standard (GHG protocol).<br />
<strong>CP</strong> wishes to estimate GHG emissions associated with its<br />
corporate activities. The purpose is to get an overview of<br />
<strong>CP</strong>’s corporate climate impact and to obtain a good<br />
foundation for reducing the GHG emissions.<br />
This is the first edition of <strong>CP</strong>’s GHG report. The report includes<br />
an introduction to <strong>CP</strong>’s activities, the boundaries of the<br />
GHG inventory, the estimated GHG emissions, and the<br />
accounting practices.<br />
The GHG inventory year is <strong>2021</strong>. Scope 1, 2 and prioritized<br />
scope 3 categories are included. For a full description of<br />
scope 1, 2, and 3, see page 6.<br />
CONTENT<br />
ABOUT <strong>CP</strong> APS ..................................................................... 3<br />
OBJECTIVES AND PURPOSE ................................................ 4<br />
GREENHOUSE GAS PROTOCOL .......................................... 5<br />
SCOPE 1, 2 AND 3................................................................ 6<br />
INVENTORY BOUNDARIES .................................................... 7<br />
EMISSIONS DURING <strong>2021</strong> ..................................................... 9<br />
EMISSIONS PER SCOPE ...................................................... 10<br />
SCOPE 1: DIRECT EMISSIONS ............................................. 11<br />
SCOPE 2: INDIRECT EMISSIONS FROM ENERGY USE ........ 12<br />
SCOPE 3: EMISSIONS FROM VALUE CHAIN ...................... 13<br />
APPENDIX 1: ACCOUNTING PRACTICES .......................... 17<br />
page 2 of 23
ABOUT <strong>CP</strong> APS<br />
<strong>CP</strong> is among the leading actors within construction site<br />
layout and facilities, letting out office and crew modules,<br />
containers, contractor equipment, lifts, and pavilions.<br />
Our mission is simple: Quality products, well thought out<br />
solutions and the best service in the industry will support<br />
the creation of optimal processes and results for our<br />
clients.<br />
For many years <strong>CP</strong> has been aware of our corporate<br />
social responsibility. Through time, this has led to initiatives<br />
regarding social responsibility, education, integration of<br />
refugees, work environment and energy efficiency. During<br />
the spring of <strong>2021</strong> we have established a sustainability<br />
committee in the company with the main purpose of<br />
pushing the green transition.<br />
With the establishment of the <strong>CP</strong> sustainability committee<br />
and the further work with this GHG inventory, we wish to<br />
take our part of the responsibility towards solving the<br />
climate related issues that the world is facing.<br />
Julie Bruun<br />
Julie Bruun, Chief Executive Officer in <strong>CP</strong> ApS.<br />
In recent years, there has been a<br />
massive focus on reducing the GHG<br />
emissions from the construction<br />
sector, which accounts for<br />
approximately one third of Danish<br />
annual emissions (direct and indirect<br />
emissions).<br />
At first, the goal was mainly to<br />
reduce the GHG emissions from the<br />
buildings – later on the attention has<br />
turned towards construction<br />
processes as well. Processes that our<br />
business take part in.<br />
page 3 of 23
Objectives and purpose<br />
<strong>CP</strong> must contribute to realizing the global goal established by the Paris Agreement: to obtain a global<br />
increase in temperature of less than 1,5 °C relative to pre-industrial levels. Therefore, <strong>CP</strong> is working on defining<br />
goals and actions to reduce our GHG emissions. Both on our own locations and through our corporate value<br />
chain.<br />
The purpose of this report is:<br />
• To identify and understand the chall<strong>eng</strong>es and opportunities related to our GHG emissions.<br />
• To identify opportunities to obtain reductions of our own GHG emissions.<br />
• To define climate goals and objectives and to monitor the development.<br />
• To involve stakeholders in reducing the GHG emissions.<br />
• To report our GHG inventory and improvements publicly and transparently.<br />
• To continuously develop and improve the data used for GHG accounting and reporting.<br />
page 4 of 23
GREENHOUSE GAS PROTOCOL<br />
The greenhouse Gas (GHG) protocol is a partnership between<br />
the World Resources Institute (WRI) and the World Business<br />
Council for Sustainable Development (WBCSD). It comprises<br />
several internationally recognized standards for accounting<br />
and reporting on greenhouse gas emissions.<br />
It includes the six greenhouse gasses mentioned in the Kyoto<br />
protocol: carbon dioxide (CO2), methane (CH4), nitrous oxide<br />
(N2O), hydrofluorocarbons (HFCs), perfluorocarbons (PFCs)<br />
and sulfur hexafluoride (SF6). 1 kg of each GHG can be<br />
converted into CO2-equivalents (kg CO2e) and added up for<br />
a total inventory of GHG emissions.<br />
The GHG protocol is the recommended standard for<br />
corporate-level GHG accounting according to the Climate<br />
Partnerships of the Danish Government 1 , the Danish Chamber<br />
of Commerce, and Global Compact Network Danmark 2 .<br />
1 "Nem-klimaguide - kom godt i gang med din CO2 beregning" Dansk Erhverv, Global Compact<br />
Network Danmark, 2020<br />
2<br />
"Finans Danmark - Fælles metode til at opgøre CO2 udledninger" Regeringens<br />
Klimapartnerskaber, <strong>2021</strong><br />
Fundamental principles<br />
Relevance: The GHG inventory must<br />
reflect corporate GHG emissions, so<br />
relevant decisions can be made on<br />
which actions to take.<br />
Completeness: Within the decided<br />
inventory boundary the company must<br />
measure and report all sources of GHG<br />
emissions. And specifically describe<br />
what’s not included.<br />
Consistency: The company must use a<br />
methodology that allows them to<br />
compare results over time. Changes<br />
made in data, inventory boundaries or<br />
other relevant aspects must be<br />
described and justified.<br />
Transparency: Boundaries, assumptions,<br />
calculations etc. must be justified by<br />
facts and causalities and described in an<br />
understandable way.<br />
Accuracy: Quantified GHG emissions<br />
should not be higher nor lower than the<br />
actual corporate GHG emissions.<br />
Decision making must be supported by<br />
the report and the report must be<br />
credible and have integrity.<br />
page 5 of 23
SCOPE 1, 2 AND 3<br />
Scope 3<br />
Indirect<br />
Scope 2<br />
Indirect<br />
Scope 1<br />
Direct<br />
Scope 3<br />
Indirect<br />
E.g., Raw material<br />
Use of electricity<br />
Company<br />
E.g., distribution,<br />
production, business<br />
and district<br />
facilities and<br />
product use and<br />
travel etc.<br />
heating<br />
vehicles<br />
disposal<br />
Upstream activities<br />
<strong>CP</strong> ApS<br />
Downstream activities<br />
Scope 1, 2 and 3<br />
The GHG protocol divides emissions into three ”scopes”:<br />
Scope 1 is the emissions from a company’s own locations or machinery (e.g. emitted through the burning of<br />
gasoline, diesel or natural gas).<br />
Scope 2 is the emissions from the production of the energy that the company purchases (e.g. electricity and<br />
district heating).<br />
Scope 3 is the emissions from the company’s corporate value chain (e.g. upstream purchases and downstream<br />
waste management).<br />
page 6 of 23
INVENTORY BOUNDARIES<br />
A company must choose an organizational inventory boundary to decide which emissions to account for in either its scope 1 and<br />
2 or its scope 3. This is to avoid that multiple companies include the same emissions in their scope 1 and 2, and to avoid that some<br />
emissions are not included in any company’s scope 1 and 2. <strong>CP</strong> has chosen to estimate and report its GHG emissions related to<br />
the principle of operational control. This means that all activities over which <strong>CP</strong> has the operational control are included in the<br />
<strong>CP</strong>’s scope 1 or 2. In the following tables <strong>CP</strong>’s GHG emitting activities is listed. In the first table, activities included in the GHG<br />
inventory are listed and in the next table activities excluded from the GHG inventory are listed. If a scope/category is listed in both<br />
tables it means some activities are included and some excluded.<br />
Scope/category<br />
Scope 1<br />
Scope 2<br />
Scope 3, category 1: Purchased goods and services<br />
Scope 3, category 2: Purchased capital goods<br />
Scope 3, category 3: Fuel- and energy related activities<br />
Scope 3, category 4: Upstream transportation and<br />
distribution<br />
Scope 3, category 5: Waste generated in operations<br />
Scope 3, category 6: Business travel<br />
Scope 3, category 13: Leased assets<br />
Included activities<br />
Activities<br />
Fuel oil for heating (Kvinderup + Vejle)<br />
Natural gas for heating (Viby Sj. + Galten)<br />
Diesel fuel for vans, trucks and equipment/machinery used by <strong>CP</strong><br />
Purchased electricity (Viby Sj. + Galten)<br />
Purchased building materials (2 main suppliers)<br />
Purchased equipment and machinery (Main supplier)<br />
Purchased electrical installation services<br />
Purchased plumbing services<br />
Purchased modules<br />
Production of fuels and fuels for energy use in scope 1 and 2<br />
Distribution loss of purchased energy<br />
Truck transport<br />
Waste management (Viby Sj. + Galten)<br />
Business travel in employee-owned cars<br />
Heat consumption in rented out modules<br />
Heat consumption in rented out pavilions<br />
Diesel filled in the rental equipment before rental period<br />
page 7 of 23
Excluded activities<br />
Scope/category Activities Cause of exclusion<br />
Scope 2 Electricity consumption Vejle No present data<br />
Scope 3, category1: Purchased goods and services<br />
Purchased goods and services<br />
(smaller suppliers)<br />
No present data<br />
Scope 3, category 2: Purchased capital goods<br />
Large purchases except<br />
equipment/machinery and No present data<br />
modules<br />
Scope 3, category 5: Waste generated in operations<br />
Waste management (Kvinderup +<br />
Vejle)<br />
No present data<br />
Scope 3, category 6: Business travel Public transportation No present data<br />
Scope 3, category 7: Employee commuting All employee commuting No present data<br />
Scope 3: category 8: Leased assets All activities No present data<br />
Scope 3, category 9: Downstream transportation and<br />
Not relevant – distribution of products<br />
-<br />
distribution<br />
included in scope 3.4<br />
Scope 3, category 10: Processing of sold products -<br />
Not relevant – no processing of sold<br />
products<br />
Scope 3, category 11: Use of sold products<br />
All use of sold products (note: use<br />
of leased assets partly included in<br />
scope 3.13)<br />
No present data<br />
Scope 3, category 12: End-of-life treatment of sold<br />
products<br />
Scope 3, category 13: Downstream leased assets<br />
All end-of-life treatment of sold<br />
products (note: end-of-life<br />
treatment of leased assets is<br />
assumed included in scope 3.5)<br />
Electricity consumption for other<br />
purposes than heating of rented<br />
out modules.<br />
Fuels consumed by<br />
equipment/machinery during<br />
No present data<br />
No present data<br />
rental period.<br />
Scope 3, category14: Franchises - Not relevant – no franchises<br />
Scope 3, category 15: Investments All investments No present data<br />
page 8 of 23
EMISSIONS DURING <strong>2021</strong><br />
Emission sources ton CO2e <strong>2021</strong> % of total<br />
Scope 1 in total 821 15%<br />
Scope 1 activities:<br />
Fuel oil 24<br />
Natural gas 76<br />
Diesel fuels 722<br />
Scope 2 in total 64 1%<br />
Scope 2 activities:<br />
Electricity* 64<br />
Scope 3 in total 4725 84%<br />
Scope 3 categories:<br />
Scope 3, category1: Purchased goods and services 506<br />
Scope 3, category 2: Purchased capital goods 947<br />
Scope 3, category 3: Fuel- and energy related activities (besides scope 1 and 2) 212<br />
Scope 3, category 4 Transportation and distribution 1412<br />
Scope 3, category 5: Waste generated in operations 15<br />
Scope 3, category 6: Business travel 11<br />
Scope 3, category 13: Downstream leased assets 1622<br />
Total scope 1 + 2 + 3 5610 100%<br />
* A location-based methodology is used for calculations of emissions from electricity; that means the emission factor from the environmental<br />
declaration on Danish electricity from Energinet. Full dataset is listed under ”Accounting practices” at the end of the report, appendix 1.<br />
page 9 of 23
ton CO 2 e<br />
EMISSIONS PER SCOPE<br />
5.000<br />
Emissions distributed in scopes, <strong>2021</strong><br />
4.725<br />
CO 2 e-emissions in % distributed in scopes, <strong>2021</strong><br />
15%<br />
4.500<br />
1%<br />
4.000<br />
3.500<br />
Scope 1<br />
Scope 2<br />
Scope 3<br />
3.000<br />
84%<br />
2.500<br />
2.000<br />
1.500<br />
1.000<br />
500<br />
0<br />
821<br />
64<br />
Scope 1 Scope 2 Scope 3<br />
<strong>CP</strong>’s total GHG emission during <strong>2021</strong> is 5610 ton<br />
CO2e, which mainly comes from activities in<br />
scope 3 (84%). This is expected because <strong>CP</strong>’s<br />
services range beyond what happens on <strong>CP</strong>’s<br />
own locations. Note, that scope 3 includes<br />
emissions from a prioritized selection of <strong>CP</strong>’s<br />
activities.<br />
page 10 of 23
SCOPE 1: DIRECT EMISSIONS<br />
<strong>CP</strong>’s total GHG emission in scope 1 is 821 ton CO2e. Diesel consumption from <strong>CP</strong>’s own vehicles accounts for 722 tons CO2e,<br />
corresponding to 88% of scope 1 emissions. <strong>CP</strong> uses diesel fuels for vans, trucks, equipment and machinery at their own sites, and<br />
for diesel consuming equipment and machinery for rental. The diesel consumption in scope 1 does not include diesel filled in rental<br />
equipment and machinery. These diesel fuels are registered in scope 3, category 13. Emissions from heating of <strong>CP</strong>’s own buildings<br />
account for the remaining 12% of total emissions in scope 1. The locations Kvinderup and Vejle are heated using fuel oil and the<br />
locations Viby Sj. And Galten are heated by natural gas. Although scope 1 does not contribute largely to <strong>CP</strong>’s total emissions, it is<br />
still a priority for <strong>CP</strong> to reduce emissions from scope 1. This is because scope 1 includes activities under <strong>CP</strong>’s direct control and<br />
influence. Scope 1 can be reduced by (1) minimizing transportation, (2) changing vehicles to less fuel consuming vehicles, (3)<br />
using a more renewable fuel type or electricity, (4) minimizing total heat consumption and (5) changing the heating source for a<br />
more renewable energy source.<br />
Emissions distributed in scope 1 activities, <strong>2021</strong><br />
ton CO 2 e<br />
0 100 200 300 400 500 600 700 800<br />
Diesel for own vehicles<br />
722<br />
Heating by fuel oil Kvinderup<br />
10<br />
Heating by fuel oil Vejle<br />
14<br />
Heating by natural gas Viby Sj.<br />
59<br />
Heating by natural gas Galten<br />
17<br />
page 11 of 23
SCOPE 2: INDIRECT EMISSIONS FROM ENERGY USE<br />
<strong>CP</strong>’s total GHG emission in scope 2 is 64 ton CO2e. Electricity consumption from <strong>CP</strong>’s head office in Viby Sj. accounts for 49 ton<br />
CO2e, corresponding to 76% of scope 2 emissions. During <strong>2021</strong> there has been no data collection from <strong>CP</strong>’s new location in Vejle.<br />
This location will be included from 2022. Approximately the same amount of electricity is used in Kvinderup and Galten, during<br />
<strong>2021</strong>. These locations account for 13% and 11% of scope 2 emissions. Although scope 2 does not contribute largely to <strong>CP</strong>’s total<br />
emissions, it is still a priority for <strong>CP</strong> to reduce scope 2 emissions. Scope 2 includes – like scope 1 – activities within <strong>CP</strong>’s direct control<br />
and influence. Scope 2 emissions can be reduced by <strong>CP</strong> producing its own renewable energy, by energy-saving or energyoptimizing<br />
initiatives. <strong>CP</strong> already produces a relatively small amount of renewable energy from a windmill in Viby Sj.<br />
Emissions distributed in scope 2 activities, <strong>2021</strong><br />
ton CO 2 e<br />
0 10 20 30 40 50 60<br />
Electricity Viby Sj.<br />
49<br />
Electricity Kvinderup<br />
8<br />
Electricity Galten<br />
7<br />
Electricity Vejle<br />
0<br />
page 12 of 23
SCOPE 3: EMISSIONS FROM VALUE CHAIN<br />
<strong>CP</strong>’s total GHG emission in scope 3 is 4770 ton CO2e. The largest emission sources are:<br />
• Category 13 Downstream leased assets (35% of scope 3)<br />
• Category 4 Transportation and distribution (30% of scope 3)<br />
• Category 2 Capital goods (20% of scope 3)<br />
• Category 1 Purchases of goods and services (11% of scope 3)<br />
Category 5 waste generated in operations and category 6 business travels, each account for less than 1% of total scope 3<br />
emissions. Category 3 energy upstream, including production and distribution of fuels and energy, consumed in scope 1 and 2,<br />
accounts for 4% of total scope 3 emissions. The following pages will present and further describe the most emission heavy<br />
categories in scope 3.<br />
Emissions distributed on scope 3 categories, <strong>2021</strong><br />
ton CO 2 e<br />
0 200 400 600 800 1.000 1.200 1.400 1.600 1.800<br />
Scope 3, category 1: Purchased good and services<br />
506<br />
Scope 3, category 2: Capital assets<br />
947<br />
Scope 3, category 3: Upstream energy<br />
212<br />
Scope 3, category 4: Transport and distribution<br />
1412<br />
Scope 3, category 5: Waste management<br />
Scope 3, category 6: Business travel<br />
15<br />
11<br />
Scope 3, category 13: Leased assets<br />
1622<br />
page 13 of 23
SCOPE 3: EMISSIONS FROM VALUE CHAIN - CONTINUED<br />
Purchased goods, services, and capital goods<br />
<strong>CP</strong>’s purchases in category 1 includes purchased construction materials from two main suppliers, equipment, and machinery etc.<br />
from the largest supplier, as well as electrical installation and plumbing services. Please note that these emissions are roughly<br />
estimated based on <strong>CP</strong>’s economic expenses related to these goods and services. On the other hand, emissions from purchased<br />
modules in category 2 capital goods are estimated using calculations from <strong>CP</strong>’s supplier of modules (square-meter-emissions from<br />
modules).<br />
Emissions distributed to activities in scope 3, category 1 and 2, <strong>2021</strong><br />
ton CO 2 e<br />
0 100 200 300 400 500 600 700 800 900 1.000<br />
Building materials purchased<br />
154<br />
Equiptment and machinery purchased<br />
43<br />
Electrical installation services purchased<br />
109<br />
Plumbing services purchased<br />
201<br />
Modules purchased<br />
947<br />
Transportation and distribution<br />
Emissions in category 4 transportation and distribution includes only truck transportation and cannot be further disseminated at this<br />
point. The emissions are also roughly estimated based on <strong>CP</strong>’s economic expenses related to truck transport.<br />
page 14 of 23
SCOPE 3: EMISSIONS FROM VALUE CHAIN - CONTINUED<br />
<strong>CP</strong>’s services are mainly to provide customers with rental assets. In this GHG inventory the following activities are included in scope<br />
3, category 13, downstream leased assets:<br />
• Electricity consumption from heating of rented out modules<br />
• Electricity consumption from heating of rented out pavilions<br />
• Diesel fuel consumed by rented out equipment and machinery<br />
<strong>CP</strong> offers modules in three different energy consuming levels; Classic, BlueLine and GreenLine. Classic and BlueLine modules are<br />
heated using electric radiators. Blue-Line differs from Classic modules by using temperature lowering during the night and having<br />
PIR sensors on light sources. In addition GreenLine has the more efficient heat pump as heating source. <strong>CP</strong> had a clinical<br />
measurement of the electricity consumption level for heating done in 2013 of all three modules. The result of this measurement is<br />
used as the foundation of the estimated emissions. The results from 2013 are degree day adjusted for <strong>2021</strong>. Electricity consumption<br />
for heating in pavilions is not tested but estimated using data from Greenline modules square-meter electric consumption. The<br />
pavilions have better insulation and are typically heated using heat pumps. The use pattern of pavilions differs from the modules –<br />
therefore this is a rough estimate. Diesel consumed in equipment and machinery for rental does not include diesel that customers<br />
themselves have refueled during the rental period, but only the diesel that <strong>CP</strong> has filled in equipment and machinery for rental<br />
during <strong>2021</strong>.<br />
Emissions distributed on activities in scope 3, category 13, <strong>2021</strong><br />
0 200 400 600 800 1.000 1.200 1.400<br />
Energy consumption in modules rented out<br />
1145<br />
Energy consumption in pavilions rented out<br />
281<br />
Diesel filled in equipment and machinery rented out<br />
196<br />
page 15 of 23
This GHG inventory and report is made by:<br />
BetterGreen ApS<br />
CVR 37679909<br />
Under Lien 3, 9000 Aalborg<br />
Virumvej 64, 2830 Virum<br />
Find BetterGreen here:<br />
www.bettergreen.dk Følg os på LinkedIn Følg os på Facebook<br />
page 16 of 23
APPENDIX 1: ACCOUNTING PRACTICES<br />
Calculation methodology<br />
CO2e-emissions per activity are calculated using the following formula<br />
CO 2 e emission = activity input ∗ emission factor<br />
The emission factor is a value describing the CO2-e emission per unit of an activity. The activity is described by the activity input.<br />
Examples of activity inputs are kWh electricity consumption or L diesel consumption. The emission factor is therefore presented as<br />
kg CO2-e/kWh or kg CO2-e/L diesel consumption. A full list of all calculation methods and emission factors is found on the next<br />
pages.<br />
Emission factors<br />
Emission factors are obtained from public authorities, databases and they are all accessible to the public. Most emission factors<br />
are not available in a disaggregated form per GHG as the GHG-protocol requires. That is why the GHG emissions in this report are<br />
only presented using CO2e. That means, all relevant emissions are included but not divided into different types of GHGs. When<br />
emission factors have been available in disaggregated form per greenhouse gas the global warming potentials (GWP) from<br />
IPCC’s AR6 from <strong>2021</strong> have been used to convert to CO2e.<br />
The following pages list the calculation methodology, emission factors, and assumptions per activity for each scope or category<br />
included in this GHG inventory.<br />
page 17 of 23
Scope 1: Direct emissions<br />
Activity Calculation method Emission factor Emission factor reference<br />
Fuel oil Per liter fuel oil purchased 3,175 kg CO2e/L<br />
Natural gas<br />
Diesel<br />
Per liter natural gas<br />
purchased<br />
Per liter diesel purchased.<br />
Furthermore, the amount of<br />
diesel filled in equipment and<br />
machinery rented out to<br />
customers has been<br />
subtracted. This diesel is<br />
accounted for in DKK excl.<br />
VAT and converted into liter<br />
diesel using: Circle K’s<br />
historical average monthly<br />
fuel prices.<br />
2,196 kg CO2e/m3<br />
2,658 kg CO2e/L<br />
DEFRA, <strong>2021</strong> "UK Government GHG Conversion Factors for<br />
Company Reporting" (Fuels - Fuel oil)<br />
https://www.gov.uk/government/publications/greenhouse<br />
-gas-reporting-conversion-factors-<strong>2021</strong><br />
Energistyrelsen, 2022, "Standardfaktorer for brændværdier<br />
og CO2-emissionsfaktorer til brug for rapporteringsåret<br />
<strong>2021</strong>" https://ens.dk/ansvarsomraader/co2-<br />
kvoter/stationaere-produktionsenheder/co2-rapporteringog-returnering<br />
(Calculated from ton CO2e/TJ to kg<br />
CO2e/m3 using conversion factor in the reference)<br />
Energistyrelsen, 2022, "Standardfaktorer for brændværdier<br />
og CO2-emissionsfaktorer til brug for rapporteringsåret<br />
<strong>2021</strong>" https://ens.dk/ansvarsomraader/co2-<br />
kvoter/stationaere-produktionsenheder/co2-rapporteringog-returnering<br />
(Calculated from ton CO2e/TJ to kg<br />
CO2e/L using conversion factor in the reference)<br />
Scope 2: Purchased energy<br />
Activity Calculation method Emission factor Emission factor reference<br />
Purchased<br />
electricity<br />
Per kWh purchased electricity<br />
0,136 kg CO2e/kWh<br />
Energinet, 2022 "Miljødeklarering af 1 kWh el, <strong>2021</strong>" (125%<br />
metoden) https://energinet.dk/El/Gron-el/Deklarationer<br />
page 18 of 23
Scope 3, category 1: Purchased goods and services<br />
Activity Calculation method Emission factor Emission factor reference<br />
Purchased building<br />
material<br />
Purchased<br />
equipment,<br />
machines etc.<br />
Purchased<br />
electricity services<br />
Purchased<br />
plumping services<br />
Per DKK economic expenses<br />
0,025 kg CO2e/DKK<br />
0,025 kg CO2e/DKK<br />
0,014 kg CO2e/DKK<br />
0,050 kg CO2e/DKK<br />
USEEIO, 2020 "Supply Chain Greenhouse Gas Emission<br />
Factors for US Industries and Commodities" (”Building<br />
material and garden equipment and supplies dealers”, ”<br />
Machinery, equipment, and supplies”, ” Electronic<br />
equipment repair and maintenance”, og ”Construction”).<br />
NOTE! Emissions are calculated from kg CO2, CH4, N2O<br />
and other gasses to CO2e by using IPCC AR6 GWPs.<br />
Furthermore, emission factors are converted from USD2018-<br />
basis to DKK<strong>2021</strong>-basis, taking inflation and exchange rates<br />
into account.<br />
https://cfpub.epa.gov/si/si_public_record_report.cfm?Lab<br />
=CESER&dirEntryId=349324<br />
Scope 3, category 2: Purchased capital goods<br />
Activity Calculation method Emission factor Emission factor reference<br />
Purchased modules Per m2 module purchased 130 kg CO2e/m2 Supplier (classified)<br />
page 19 of 23
Scope 3, category 3: Energy upstream<br />
Activity Calculation method Emission factor Emission factor reference<br />
Diesel fuel well-totank<br />
Per L diesel fuel purchased<br />
0,61 kg CO2e/L<br />
Fuel oil well-to-tank Per L fuel oil purchased 0,697 kg CO2e/L<br />
Natural gas well-totank<br />
Electricity well-totank<br />
Distribution loss<br />
Per m3 natural gas<br />
purchased<br />
Per kWh electricity purchased<br />
5% of electricity consumption<br />
including Well-to-tank<br />
0,346 kg CO2e/m3<br />
0,053 kg CO2e/kWh<br />
- -<br />
DEFRA, <strong>2021</strong> "UK Government GHG Conversion Factors for<br />
Company Reporting"<br />
https://www.gov.uk/government/publications/greenhousegas-reporting-conversion-factors-<strong>2021</strong><br />
Scope 3, category 4: Transportation and distribution<br />
Activity Calculation method Emission factor Emission factor reference<br />
Truck transport<br />
services<br />
Per DKK economic expenses<br />
0,214 kg CO2e/DKK<br />
USEEIO, 2020 "Supply Chain Greenhouse Gas Emission<br />
Factors for US Industries and Commodities" (”Truck<br />
transportation”). NOTE! Emissions are calculated from kg<br />
CO2, CH4, N2O and other gasses to CO2e by using IPCC<br />
AR6 GWPs. Furthermore, emission factors are converted<br />
from USD2018-basis to DKK<strong>2021</strong>-basis, taking inflation and<br />
exchange rates into account.<br />
https://cfpub.epa.gov/si/si_public_record_report.cfm?Lab<br />
=CESER&dirEntryId=349324<br />
page 20 of 23
Scope 3, category 5: waste<br />
Activity Calculation method Emission factor* Emission factor reference<br />
Construction waste sorted, recycling<br />
0,0009891 kg CO2e/kg<br />
Gypsum waste clean fraction, recycling<br />
0,021294 kg CO2e/kg<br />
Iron, recycling<br />
0,021294 kg CO2e/kg<br />
Cardboard, loose, recycling<br />
Wood, class A2, construction wood, recycling<br />
Accumulators, recycling<br />
Oil filters, recycling<br />
Spray cans, recycling<br />
Waste oil, recycling<br />
Landfill waste, sorted, landfill<br />
Soil, class 4, landfill<br />
Per kg produced waste<br />
per fraction sent for<br />
different types of waste<br />
treatments<br />
0,021294 kg CO2e/kg<br />
0,021294 kg CO2e/kg<br />
0,021294 kg CO2e/kg<br />
0,021294 kg CO2e/kg<br />
0,021294 kg CO2e/kg<br />
0,021294 kg CO2e/kg<br />
0,467046 kg CO2e/kg<br />
0,017583 kg CO2e/kg<br />
DEFRA, <strong>2021</strong> "UK<br />
Government GHG<br />
Conversion Factors for<br />
Company Reporting"<br />
DEFRA, <strong>2021</strong> "UK<br />
Government GHG<br />
Conversion Factors for<br />
Company Reporting"<br />
https://www.gov.uk/govern<br />
ment/publications/greenho<br />
use-gas-reportingconversion-factors-<strong>2021</strong><br />
Wood, pressure impregnated, landfill<br />
0,021294 kg CO2e/kg<br />
Construction waste/combustible waste, combustion<br />
0,021294 kg CO2e/kg<br />
Small combustible waste, combustion<br />
0,021294 kg CO2e/kg<br />
*Note that for waste management by combustion or recycling the emission factors include only a standardized emission from transportation of<br />
waste to treatment. The reason for this is that the burdens/savings from combustion or recycling of materials are assigned to the consumers of<br />
the produced energy and recycled materials, which is in line with recommendations by the GHG-protocol. When it comes to landfill, the<br />
emission factor does include emissions from landfilling.<br />
page 21 of 23
Scope 3, category 6: Business travels<br />
Activity Calculation method Emission factor Emission factor reference<br />
Business travel in<br />
employee-owned<br />
cars<br />
Per amount of transportation<br />
compensation paid to<br />
employees. This is converted<br />
into km using the <strong>2021</strong><br />
government rate, assuming<br />
every employee travels less<br />
than 20.000 km/year (3,44<br />
DKK/km).<br />
0,164 kg CO2e/km<br />
(direct)<br />
+<br />
0,045 kg CO2e/km<br />
(well-to-tank)<br />
Direct: Energistyrelsen, 2020 ”Emissionsfaktorer for<br />
vejtransporten (pr. km.)” NOTE! Emission factor is<br />
calculated as the average of an average diesel fueled<br />
car and an average petrol fueled car.<br />
https://ens.dk/sites/ens.dk/files/Analyser/emissionsfaktorer_<br />
for_vejtransporten_pr._km.pdf<br />
Well-to-tank: DEFRA, <strong>2021</strong> "UK Government GHG<br />
Conversion Factors for Company Reporting"<br />
https://www.gov.uk/government/publications/greenhouse<br />
-gas-reporting-conversion-factors-<strong>2021</strong><br />
Scope 3, category 13: Downstream leased assets<br />
Activity Calculation method Emission factor Emission factor reference<br />
Electricity<br />
consumption for<br />
heating in<br />
rented out<br />
modules<br />
Per kWh electricity consumption of rental modules in<br />
<strong>2021</strong>.<br />
Electricity consumption for heating of three types of<br />
modules measured in a clinical test during February<br />
2013. The result is scaled up to fit a yearly consumption<br />
in a normal year of 2906 degree days, and from here<br />
the daily average consumption is calculated. The<br />
results of the test are corrected from a normal year of<br />
2906 degree days into 3098 degree days in <strong>2021</strong>.<br />
The calculated electricity consumption for heating on<br />
an average day in <strong>2021</strong> is multiplied by the number of<br />
rental days pr. module type. Electricity consumption for<br />
heating in kWh/day for Classic, BlueLine and<br />
GreenLine in <strong>2021</strong> is 18, 12 and 7 kWh/day,<br />
respectively.<br />
0,136 kg<br />
CO2e/kWh<br />
(direct)<br />
0,053 kg<br />
CO2e/kWh<br />
(well-to-tank)<br />
Direct: Energinet, 2022 "Miljødeklarering af 1<br />
kWh el, <strong>2021</strong>" (125% metoden)<br />
https://energinet.dk/El/Gronel/Deklarationer<br />
Well-to-tank: DEFRA, <strong>2021</strong> "UK Government<br />
GHG Conversion Factors for Company<br />
Reporting"<br />
https://www.gov.uk/government/publicatio<br />
ns/greenhouse-gas-reporting-conversionfactors-<strong>2021</strong><br />
page 22 of 23
Activity Calculation method Emission factor Emission factor reference<br />
Electricity<br />
consumption for<br />
heating in rental<br />
pavilions<br />
Diesel in rental<br />
equipment and<br />
machinery<br />
Per kWh electricity consumption of rental pavilions in<br />
<strong>2021</strong>. Electricity consumption for heating from pavilions<br />
is not tested but estimated as equal to the Greenline<br />
module’s electricity consumption per square-meter,<br />
scaled to the pavilions square-meter.<br />
GreenLine heat consumption is assumed for pavilions<br />
due to better insulation in the pavilions compared to<br />
the modules and since they are typically heated by<br />
heat pumps. Due to a different pattern in usage, this is<br />
a rough estimate. Electricity consumption for heating in<br />
kWh/day for 40 and 48 m2 pavilions in <strong>2021</strong> is 11 and 13<br />
kWh/day, respectively.<br />
Per liter diesel fuel sold to customers (fuel filled in rental<br />
equipment and machinery from <strong>CP</strong>’s own diesel<br />
station). This diesel is accounted for in DKK excl. VAT<br />
and converted into liter diesel using: Circle K’s historical<br />
average monthly fuel prices.<br />
0,136 kg<br />
CO2e/kWh<br />
(direct)<br />
0,053 kg<br />
CO2e/kWh<br />
(well-to-tank)<br />
2,658 kg CO2e/L<br />
(direct)<br />
0,61 kg CO2e/L<br />
(well-to-tank)<br />
Direct: Energinet, 2022 "Miljødeklarering af 1<br />
kWh el, <strong>2021</strong>" (125% metoden)<br />
https://energinet.dk/El/Gronel/Deklarationer<br />
Well-to-tank: DEFRA, <strong>2021</strong> "UK Government<br />
GHG Conversion Factors for Company<br />
Reporting"<br />
https://www.gov.uk/government/publicatio<br />
ns/greenhouse-gas-reporting-conversionfactors-<strong>2021</strong><br />
Energistyrelsen, 2022, "Standardfaktorer for<br />
brændværdier og CO2-emissionsfaktorer til<br />
brug for rapporteringsåret <strong>2021</strong>"<br />
https://ens.dk/ansvarsomraader/co2-<br />
kvoter/stationaereproduktionsenheder/co2-rapportering-ogreturnering<br />
(Calculated from ton CO2e/TJ<br />
into kg CO2e/L using the conversion factor<br />
in the reference)<br />
Well-to-tank: DEFRA, <strong>2021</strong> "UK Government<br />
GHG Conversion Factors for Company<br />
Reporting"<br />
https://www.gov.uk/government/publicatio<br />
ns/greenhouse-gas-reporting-conversionfactors-<strong>2021</strong><br />
page 23 of 23