The Big I Virginia Winter 2022-23

Create successful ePaper yourself
Turn your PDF publications into a flip-book with our unique Google optimized e-Paper software.
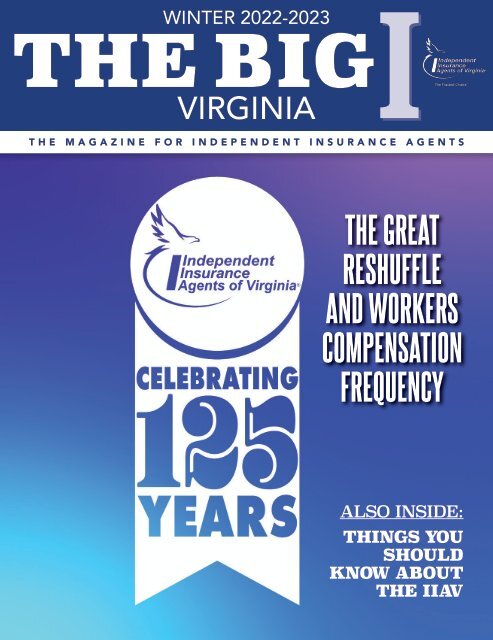
WINTER <strong>2022</strong>-20<strong>23</strong><br />
VIRGINIA<br />
THE MAGAZINE FOR INDEPENDENT INSURANCE AGENTS<br />
THE GREAT<br />
RESHUFFLE<br />
AND WORKERS<br />
COMPENSATION<br />
FREQUENCY<br />
ALSO INSIDE:<br />
THINGS YOU<br />
SHOULD<br />
KNOW ABOUT<br />
THE IIAV
oofing quote?<br />
Need a roofing<br />
Give us a call -<br />
house!<br />
It’s on the house!<br />
P&C Underwriters Samantha Pardue &<br />
Noah McMurray and CUO Tony Costa can<br />
help you nail down your roofer’s needs.<br />
Property & Casualty<br />
Property (building, BPP, BI)<br />
General Liability<br />
Excess Liability<br />
Ocean Marine<br />
Prize Indemnification<br />
Special Events<br />
Liquor Liability<br />
Excess Wind<br />
Equipment Breakdown<br />
Crime<br />
Transportation<br />
Auto Liability<br />
Physical Damage<br />
Cargo<br />
Garage Liability<br />
Garagekeepers<br />
Workers Comp<br />
Artisan Contractors<br />
Restaurants<br />
Over 700 classes available!<br />
Professional Liability<br />
Architects<br />
Engineers<br />
Cyber<br />
Non-Profit D&O<br />
Corporate D&O<br />
Medical Malpractice<br />
Social Services<br />
Misc E&O<br />
EPLI<br />
Technology Professional<br />
Media Professional<br />
Excess Professional<br />
Personal Lines<br />
Umbrellas<br />
Homeowners<br />
Personal Inland Marine Floaters<br />
In-Home Businesses<br />
Flood<br />
Primary<br />
Excess<br />
NC | SC | VA | GA | TN | MD<br />
800-342-5572<br />
www.jsausa.com<br />
#jsausa
BuildersMutual.com<br />
THE BEST-PROTECTED JOB-SITES<br />
HAVE HARDHATS, GUARDRAILS,<br />
AND BUILDERS MUTUAL.<br />
Dedicated exclusively to construction since 1984, we understand this industry better than anyone<br />
else. We will be here for years to come to protect you, your employees, and your business.
WINTER <strong>2022</strong>-<strong>23</strong><br />
<strong>The</strong> <strong>Big</strong> I <strong>Virginia</strong> is a publication of the<br />
Independent Insurance Agents of <strong>Virginia</strong><br />
8600 Mayland Drive, Richmond, VA <strong>23</strong>294<br />
Phone: 804.747.9300 / Toll-free: 800.288.IIAV (4428)<br />
Fax: 804.747.6557 / E-mail: members@iiav.com / Website: iiav.com<br />
IIAV IS AN ORGANIZATION DEVOTED TO<br />
PROMOTING, ENHANCING, SERVING AND<br />
ASSISTING INDEPENDENT INSURANCE AGENTS.<br />
<strong>The</strong> <strong>Big</strong> “I” is a trademark owned by the Independent<br />
Insurance Agents & Brokers of America, Inc. (“IIABA”), and is<br />
being used with the permission of IIABA.<br />
INSIDE<br />
6 Message from the Chairman of the Board Mike Yergey<br />
8 Message from the President & CEO Robert N. Bradshaw Jr.<br />
11 Celebrating 125 Years<br />
12 Message from the State National Director Michael Funkhouser<br />
14 <strong>The</strong> Great Reshuffle and Workers Compensation Frequency<br />
24 IIAV Bids Farewell to Linda Loving<br />
25 Things You Should Know about the IIAV<br />
26 IRV Methodologies, Replacement Cost and Reconstruction Cost<br />
THANK YOU ADVERTISERS<br />
32 Applied Underwriters<br />
auw.com/MoreToLove<br />
8 Berkshire Hathaway<br />
GUARD Ins<br />
guard.com/apply<br />
3 Builders Mutual Insurance<br />
BuildersMutual.com<br />
7 Harford Mutual<br />
HarfordMutual.com<br />
5 Iroquois Group<br />
IroquoisGroup.com<br />
2 Jackson Sumner<br />
& Associates<br />
jsausa.com<br />
For more information on advertising, contact Eric Johnson<br />
Blue Water Publishers, LLC / 9406 N. 107th St., Milwaukee, WI 53224<br />
414-708-2059 / fax: 414-354-5317 / eric@bluewaterpublishers.com<br />
10 Penn National<br />
PennNationalInsurance.com<br />
9 SIAA<br />
31 Summit Holdings<br />
summitholdings.com<br />
IIAV Staff<br />
Robert N. Bradshaw, Jr., MAM<br />
President & CEO<br />
rbradshaw@iiav.com<br />
Cell (804) 929-4134<br />
Teri Chester<br />
Executive Secretary/<br />
Receptionist<br />
& Membership Coordinator<br />
tchester@iiav.com<br />
Joe Hudgins, CPCU<br />
Technical Consultant<br />
jhudgins@iiav.com<br />
Cell (804) 929-4138<br />
Bonnie Joyce<br />
Senior Insurance<br />
Administrative Assistant<br />
bjoyce@iiav.com<br />
Linda Loving, CIC, AISM, AIAO<br />
IIAV Chief Operating Officer<br />
& VFSC Executive Vice President<br />
lloving@iiav.com<br />
Cell (804) 929-4133<br />
Susan E. C. Perkins<br />
Membership/Education<br />
Coordinator<br />
sperkins@iiav.com<br />
Bonnie J. Warren,<br />
ACSR, CPIW, DAE, RPLU<br />
Insurance Account Executive<br />
bwarren@iiav.com<br />
Vera Wooden<br />
Insurance Account Executive<br />
vwooden@iiav.com<br />
Donald W. Bragg,<br />
CPCU, CIC, CPIA, MBA<br />
Director of Membership<br />
& Marketing<br />
dbragg@iiav.com<br />
Melanie DeCola<br />
Insurance Account Executive<br />
mdecola@iiav.com<br />
Debbi Little<br />
Director of Professional<br />
Development and Programs &<br />
Executive Director for VAIA<br />
(804)747-6557<br />
dlittle@iiav.com<br />
<strong>The</strong> <strong>Big</strong> I <strong>Virginia</strong> is a publication of the Independent Insurance Agents<br />
of <strong>Virginia</strong> and is published quarterly by Blue Water Publishers, LLC. <strong>The</strong><br />
Independent Insurance Agents of <strong>Virginia</strong>, Inc. reserves the right in its sole<br />
discretion to reject advertising that does not meet IIAV qualifications or which<br />
may detract from its business, professional or ethical standards. IIAV and Blue<br />
Water Publishers, LLC do not necessarily endorse any of the companies<br />
advertising in the publication or the views of its writers. <strong>The</strong> publisher cannot<br />
assume responsibility for claims made by advertisers, content provided by<br />
the editor, or for the opinions expressed by contributing authors.<br />
4 THE BIG I VIRGINIA WINTER <strong>2022</strong>-<strong>23</strong>
Built To Fit<br />
How is it that <strong>The</strong> Iroquois<br />
Group works effectively with<br />
Member Agencies with $2<br />
million in premium and others<br />
with $200 million?<br />
Because Iroquois builds a<br />
custom solution for each<br />
agency utilizing our markets,<br />
resources and benefits. We<br />
can create just the right fit<br />
for your agency too.<br />
For over 40 years Iroquois has<br />
helped agencies grow their<br />
revenue and strengthen their<br />
independence.<br />
Visit IroquoisGroup.com to<br />
explore what we can design<br />
for your agency.<br />
Is Iroquois <strong>The</strong> Right<br />
Fit For Your Agency?<br />
Want to avoid initiation or monthly fees?<br />
We don't charge any.<br />
Want to earn superior compensation from<br />
your carriers?<br />
We can show you how.<br />
Want direct carrier appointments outside<br />
the Iroquois network?<br />
Not a problem.<br />
Want to remain independent and in charge<br />
of your agency?<br />
We offer information and options, but you<br />
make all the decisions for what is best for<br />
your agency.
<strong>2022</strong>-<strong>23</strong> CHAIRMAN OF THE BOARD<br />
MICHAEL YERGEY<br />
Members@iiav.com<br />
CELEBRATING THE PAST & COMMITTEE TO THE FUTURE<br />
Yes, IIAV is celebrating our 125th anniversary<br />
from our founding in 1898. Few organizations<br />
survive that long and few have maintained their<br />
relevance for that long. <strong>The</strong> political, educational and<br />
informational needs of independent agents have not only<br />
been maintained over the years but some would argue<br />
have become more critical to the successful and efficient<br />
agency of today. That is certainly more of a reality in these<br />
days of cyber liability insurance.<br />
<strong>The</strong> IIAV convention — June 25-27 — will celebrate this<br />
progress while also laying the foundation for the challenges<br />
of the future. First and foremost we will hear from Crystal<br />
Washington a futurist — as our keynote opening speaker<br />
who will lay the foundation for the convention to come.<br />
Our secondary keynote speaker — Doug Smith with Erie<br />
— will present the future trends more specifically to the<br />
insurance industry. And Jon Jensen — IIABA Chairman<br />
for 2019-20 — Will outline what he sees as the future of<br />
the independent agent. Jon is President of the Correll<br />
Insurance Group in Spartanburg, South Carolina, one<br />
of the premier independent insurance agencies in the<br />
Southeast.<br />
<strong>The</strong> convention will have a number of informational breakout<br />
sessions dealing with the issues of the day and for the<br />
tradeshow, will allow you to transition from one decade to<br />
another adding some fun and levity to the convention event.<br />
Why should you attend?<br />
• Networking among your peers.<br />
• Industry updates such as the annual state of the<br />
industry from Insurance Commissioner Scott White.<br />
• A massive trade show with networking among our<br />
company partners.<br />
• And simply put, fun at the beach —<br />
make it a family affair.<br />
• Expand your knowledge, learn and<br />
improve.<br />
• Hear directly from successful agencies<br />
• And much more.<br />
I don’t believe I’ve ever attended<br />
a convention where I didn’t meet<br />
someone new and learn about<br />
the successful operations of other<br />
agencies.<br />
In the coming months, you’ll hear<br />
more about the IIAV convention which<br />
will again be located at the <strong>Virginia</strong><br />
Beach Oceanfront Marriott — just an<br />
absolutely beautiful location. I’d love<br />
to meet you there and if you have any<br />
questions about the convention, don’t<br />
hesitate to contact me at members@<br />
iiav.com.<br />
Remember, Celebrating the Past<br />
& Committed to the Future … IIAV<br />
125 years of progress. IIAV is YOUR<br />
association, I look forward to seeing<br />
you there.<br />
6 THE BIG I VIRGINIA WINTER <strong>2022</strong>-<strong>23</strong>
Harford Mutual<br />
Insurance Group<br />
is a Ward’s 50 ®<br />
top-performing property-casualty<br />
insurance company for the<br />
second consecutive year.<br />
<strong>2022</strong> & 2021<br />
We partner with independent<br />
agents to insure restaurants,<br />
contractors, mercantile, and<br />
other commercial entities.
PRESIDENT & CEO<br />
ROBERT N.<br />
BRADSHAW, JR., MAM<br />
rbradshaw@iiav.com<br />
IT IS A POLITICAL THING … AND A RELATIONSHIP THING<br />
When I first joined the staff at IIAV — after over<br />
20 years in D.C. — I asked the membership<br />
if they knew or had contacts with any of the<br />
legislators … and if they did, to please introduce me to<br />
them. Bill Ball an agent in Richmond introduced me to<br />
Sen. John Chichester who was at the time President Pro-<br />
Temp and Finance Committee Chair of the Senate. Next<br />
to the House Leader, Sen. Chichester was one of the most<br />
important people in the Legislature. I recall going to meet<br />
the senator at his office and he was engaged in a rather<br />
angry conversation on the phone with the governor at the<br />
time. I was a little taken aback but when the senator hung<br />
up the phone, his demeanor changed dramatically and he<br />
welcomed me to Richmond. <strong>The</strong> three of us discussed the<br />
insurance industry for a little while and before we closed<br />
our meeting, Sen. Chichester told me that he would NOT<br />
carry any legislation for me. Because of his position, and<br />
many demands for quid-pro-quo voting, that he didn’t<br />
want to be put in an unethical position. Further, because<br />
of his involvement in the insurance industry, he would<br />
likely recuse himself from any legislation that might have a<br />
conflict of interest. That said, he did offer to help with any<br />
legislative background or guidance that I needed and to<br />
stay in touch.<br />
Continued on page 10 >><br />
Thank you for your business & Happy New Year.<br />
8 THE BIG I VIRGINIA WINTER <strong>2022</strong>-<strong>23</strong>
WINTER <strong>2022</strong>-<strong>23</strong> THE BIG I VIRGINIA 11
STATE NATIONAL DIRECTOR<br />
MICHAEL F. FUNKHOUSER<br />
mike@haunm.net<br />
I AM A TRUSTED CHOICE AGENT. WHAT NOW?<br />
Did you know that your Association membership<br />
automatically makes you a Trusted Choice Insurance<br />
Agent? Let’s discuss what that means, and how it can help<br />
you to effectively brand and market your agency.<br />
<strong>The</strong> Trusted Choice website, trustedchoice.<br />
independentagent.com, states that “Trusted Choice is a<br />
co-brand designed to complement the local marketing<br />
efforts of independent agents, extend their reach, and<br />
drive more consumers to independent agencies.” Sounds<br />
great, right? <strong>The</strong> tools are provided on the website for<br />
“one stop shopping” and since the tools are a benefit of<br />
membership, there are no charges!<br />
<strong>The</strong> goal is to educate consumers on the value of<br />
Independent Agents while providing you with marketing<br />
resources to connect with consumers and be a part of the<br />
collective brand.<br />
What can Trusted Choice provide you?<br />
Content to Share: Graphics, infographics, videos, and<br />
articles to share on social media or your website. Much<br />
of the information is simply copy and paste to whatever<br />
platform you want to use. <strong>The</strong>re are hundreds of messages<br />
to choose from and a variety of subjects depending on<br />
who you are targeting. <strong>The</strong>re is also a “Content Calendar”<br />
to help plan your social media posts with this ready to use<br />
content.<br />
Marketing Campaigns: Print ads, digital ads, and videos<br />
to complement your efforts. Select from a variety of<br />
consumer-tested, customizable advertising campaigns<br />
you can use to highlight your agency’s unique value.<br />
Programs and Services:<br />
• Marketing Reimbursement – All members<br />
are eligible for reimbursement of 50% of cost<br />
(maximum $750) for co-branded marketing efforts.<br />
Co-branding is defined as supplementing your<br />
agency’s own branding with the Trusted Choice<br />
logo. This can be in traditional (print ads, flyers,<br />
signage, billboards) or digital (online, apps, social<br />
media, TV) platforms.<br />
• Website upgrade – Upgrade your web presence by<br />
using one of Trusted Choice’s vetted vendors to build<br />
your agency a new webpage, and receive a $500<br />
reimbursement. Trusted Choice also provides a free<br />
review of your current website’s performance to see if<br />
it’s time to upgrade.<br />
• Free Digital review – A complete analysis of your<br />
website and social media channels. This review is a<br />
comprehensive 30+ page report that includes Search<br />
Engine Optimization score, Keyword Audit,<br />
Competitor Analysis, and a Social Media<br />
Review. <strong>The</strong> report also includes Best<br />
Practices documents to help you take<br />
your agency’s online presence to<br />
the next level.<br />
That’s a lot of bang for<br />
your membership buck! Visit<br />
trustedchoice.independentagent.<br />
com today and take advantage of these incredible benefits!<br />
12 THE BIG I VIRGINIA WINTER <strong>2022</strong>-<strong>23</strong>
WINTER <strong>2022</strong>-<strong>23</strong> THE BIG I VIRGINIA 13
By Authors Names Here<br />
THE GREAT RESHUFFLE<br />
<strong>The</strong> Great Reshuffle AND and Workers WORKERS Compensation Frequency<br />
COMPENSATION FREQUENCY<br />
Key Findings<br />
By Patrick Coate<br />
• <strong>The</strong> Great Reshuffle led to a modest increase in the share of short-tenured workers, a few percentage<br />
points in most sectors<br />
KEY • FINDINGS<br />
Short-tenured workers in most sectors are close to twice as likely to suffer work injuries than fulltenured<br />
Great Reshuffle workers, led but to their a modest relative increase risk is in lower the in in-person almost 10 million service more sectors than pre-pandemic averages. Many<br />
• <strong>The</strong><br />
share of short-tenured workers, a few percentage workers are new to their jobs. Some of these are moving<br />
• <strong>The</strong> explosion of remote work during the pandemic put downward pressure on injury frequency,<br />
points in most sectors<br />
from one similar job to another, but others are changing<br />
especially in office-based sectors<br />
• Short-tenured workers in most sectors are close to<br />
industries or occupations. At the same time, there are a<br />
• <strong>The</strong> net impact on frequency across multiple sectors,<br />
twice as likely to suffer work injuries than full- tenured<br />
large like number a state of or new book remote of business, workers. will Many vary people based on left<br />
the office at COVID’s onset; there has been a trickle back,<br />
workers, the changes but their in relative industry risk mix is and lower the in frequency in-person metric<br />
• representing a massive change in the amount of remote<br />
service <strong>The</strong> sectors Great Reshuffle may have contributed to frequency anomalies in 2020 and 2021, but it is likely to<br />
work compared to before the pandemic.<br />
• <strong>The</strong> cause explosion only of small remote deviations work during from the frequency pandemic trends in the coming years<br />
How do such large changes in the labor market impact<br />
put downward pressure on injury frequency, especially<br />
workers compensation injury frequency? <strong>The</strong> magnitude<br />
in office-based sectors<br />
of these impacts relies on the interaction of three factors:<br />
• <strong>The</strong> net impact on frequency across multiple sectors,<br />
like a state or book of business, will vary based on the<br />
changes in industry mix and the frequency metric<br />
• <strong>The</strong> Great Reshuffle may have contributed to<br />
frequency anomalies in 2020 and 2021, but it is likely<br />
to cause only small deviations from frequency trends<br />
in the coming years<br />
INTRODUCTION<br />
<strong>The</strong> Great Reshuffle is reshaping the US labor market.<br />
Unemployment is historically low, but labor force<br />
participation is still lower than the pre-pandemic rate.<br />
Labor shortages have led to wage growth, especially<br />
strong among low-wage workers and in sectors like Leisure<br />
and Hospitality.<br />
Quit rates jumped in the middle of 2021 and remain high<br />
at the time of this writing—about 50 million quits a year,<br />
September <strong>2022</strong><br />
By Patrick Coate<br />
• How much more or less likely are short-tenured or<br />
remote workers to be injured than other workers?<br />
• How much has the share of such workers changed?<br />
• How has the sector mix of the workforce changed<br />
during the pandemic?<br />
SHORT–TENURED WORKERS<br />
How many short-tenured workers are there?<br />
<strong>The</strong> first question to answer is how many short-tenured<br />
workers are there in the labor market and in each sector?<br />
In the chart below, we show estimates of the share of<br />
short-tenured workers (12 months or less with their current<br />
employer) for the years immediately preceding the<br />
pandemic. Two observations stand out.<br />
First, there were a lot of short-tenured workers in all sectors,<br />
even before the pandemic. Since 2012, the average share<br />
© Copyright <strong>2022</strong> National Council on Compensation Insurance, Inc. All Rights Reserved.<br />
©<br />
THE<br />
Copyright<br />
RESEARCH<br />
<strong>2022</strong><br />
ARTICLES<br />
National<br />
AND<br />
Council<br />
CONTENT<br />
on Compensation<br />
DISTRIBUTED<br />
Insurance,<br />
BY NCCI ARE<br />
Inc.<br />
PROVIDED<br />
All Rights<br />
FOR<br />
Reserved.<br />
GENERAL INFORMATIONAL PURPOSES ONLY AND ARE PROVIDED “AS<br />
IS.” NCCI DOES NOT GUARANTEE THEIR ACCURACY OR COMPLETENESS NOR DOES NCCI ASSUME ANY LIABILITY THAT MAY RESULT IN YOUR RELIANCE UPON<br />
THE SUCH RESEARCH INFORMATION. ARTICLES NCCI AND EXPRESSLY CONTENT DISCLAIMS DISTRIBUTED ANY AND BY NCCI ALL WARRANTIES ARE PROVIDED OF ANY FOR KIND GENERAL INCLUDING INFORMATIONAL ALL EXPRESS, PURPOSES STATUTORY ONLY AND AND IMPLIED ARE WARRANTIES<br />
PROVIDED<br />
“AS INCLUDING IS.” NCCI THE DOES IMPLIED NOT GUARANTEE WARRANTIES THEIR OF MERCHANTABILITY ACCURACY OR COMPLETENESS AND FITNESS FOR NOR A PARTICULAR DOES NCCI PURPOSE. ASSUME ANY LIABILITY THAT MAY RESULT IN YOUR<br />
RELIANCE UPON SUCH INFORMATION. NCCI EXPRESSLY DISCLAIMS ANY AND ALL WARRANTIES OF ANY KIND INCLUDING ALL EXPRESS, STATUTORY AND<br />
14 THE IMPLIED BIG WARRANTIES I VIRGINIA INCLUDING WINTER THE <strong>2022</strong>-<strong>23</strong> IMPLIED WARRANTIES OF MERCHANTABILITY AND FITNESS FOR A PARTICULAR PURPOSE.
Introduction<br />
<strong>The</strong> Great Reshuffle is reshaping the US labor market. Unemployment is historically low, but labor force<br />
participation is still lower than the pre-pandemic rate. Labor shortages have led to wage growth, especially<br />
strong among low-wage workers and in sectors like Leisure and Hospitality.<br />
Quit rates jumped in the middle of 2021 and remain high at the time of this writing—about 50 million quits a<br />
year, almost 10 million more than pre-pandemic averages. Many workers are new to their jobs. Some of these<br />
are moving from one similar job to another, but others are changing industries or occupations. At the same<br />
time, there are a large number of new remote workers. Many people left the office at COVID’s onset; there has<br />
been a trickle back, representing a massive change in the amount of remote work compared to before the<br />
pandemic.<br />
of short-tenured workers across all sectors has consistently Manufacturing subsectors responded to lower labor<br />
been How between do such 21–<strong>23</strong>%. large changes This is not in the a historical labor market anomaly— impact demand workers compensation in 2020 by reducing injury frequency? hours and <strong>The</strong> enacting magnitude<br />
the of short-tenured these impacts share relies was on even the higher interaction the of late three 1990s factors: temporary plant shutdowns. 2 Cutbacks in work hours<br />
and early 2000s before the Great Recession. 1 In other reduced layoffs. Consequently, manufacturing firms met<br />
words, there • How is always much a more substantial or less share likely of are workers short-tenured who recovering or remote labor workers demand to be in injured part by than restoring other work workers? hours<br />
are new • on the How job. much has the share of such workers changed? rather than new hiring.<br />
Second, • the How share has of the short-tenured sector mix workers of the workforce varies widely changed We during estimate the the pandemic? change in the share of short-tenured<br />
by sector, but all sectors have a substantial share of shorttenured<br />
workers in any given year. Leisure and Hospitality sources. <strong>The</strong> Current Population Survey (CPS) conducts<br />
workers during 2021 using a combination of two data<br />
has the highest share of short-tenured workers, at nearly a biennial survey supplement on employee tenure in<br />
40% in the years prior to the pandemic. Retail Trade, around January of even years. However, the latest published report<br />
30%, also has a high share of short- tenured workers. Even contains data from January 2020, predating the onset of<br />
in sectors with the lowest shares of short-tenured workers, the pandemic. 3 Thus, we estimate more recent shares of<br />
Manufacturing, Wholesale Trade, and Financial Activities, short-tenured workers using the Job Openings and Labor<br />
about 18% of workers are in the first year at their employer. Turnover Survey (JOLTS).<br />
What happened during the pandemic<br />
and recovery?<br />
We estimate that the share of short-tenured workers<br />
increased modestly in 2021. <strong>The</strong> share of short-tenured<br />
workers in Leisure and Hospitality increased from 41% to<br />
48%; in Retail Trade from 30% to 33%; and in Transportation<br />
and Warehousing, from 24% to 27%.<br />
We estimate smaller changes—or even no change—<br />
in sectors where hiring rates did not change much—in<br />
late 2020 and during 2021—from pre-pandemic norms.<br />
<strong>The</strong>se sectors include Professional and Business Services,<br />
Financial Activities, Information, Manufacturing, and<br />
Wholesale Trade.<br />
<strong>The</strong> first three of these sectors require relatively little inperson<br />
contact with customers and are conducive to<br />
remote work, as we will discuss further in the next section.<br />
<strong>The</strong>se sectors suffered fewer job losses than average at the<br />
pandemic’s onset and less reshuffling of workers during<br />
the recovery.<br />
<strong>The</strong> latter two sectors have relatively high shares of longtenured<br />
workers and experienced less turnover. Some<br />
By our definition, short-tenured workers are those who<br />
were hired at their current employer in the last 12 months.<br />
<strong>The</strong>refore, we can get a very good estimate of shorttenured<br />
worker share by using average JOLTS hiring<br />
rates by sector (new hires/total workers) for the trailing 12<br />
months. Although some new hires will change jobs again<br />
or leave the workforce before serving a full year on the<br />
job, prior 12-month hiring rate correlates very strongly<br />
in all sectors with the share of short-tenured workers as<br />
measured by the CPS supplement.<br />
Examining the JOLTS data can illuminate why we estimate<br />
only a modest increase in short-tenured workers.<br />
• Private industry hire rates were between 4.0-4.4% every<br />
month for over five years before the pandemic’s onset.<br />
• After a dip and subsequent spike in the second quarter<br />
of 2020, during the initial phase of the COVID-19<br />
pandemic, hire rates have steadily been 4.4-5.0% every<br />
month from July 2020 through June <strong>2022</strong>.<br />
• Hiring rates have thus increased between 10-15%<br />
during the Great Reshuffle, with some variation by<br />
sector as reflected in our estimates shown above.<br />
WINTER <strong>2022</strong>-<strong>23</strong> THE BIG I VIRGINIA 15
<strong>The</strong>re were over 65 million new hires in 2019, so this increase an important concept regarding our method. Our relative<br />
is large<br />
Introduction<br />
in absolute terms, but it led to a modest increase in risk measure is a combination of two components:<br />
the share of short-tenured workers in 2021. Because hiring<br />
<strong>The</strong> Great Reshuffle is reshaping the US labor market. Unemployment • How much more is historically likely a short-tenured low, but labor worker force to be<br />
rates in the first half of <strong>2022</strong> are very close to the 2021<br />
average, participation we estimate is still the lower overall than share the pre-pandemic of short-tenured rate. Labor injured shortages than have a full-tenured led to wage worker growth, while especially performing<br />
the same task<br />
workers strong in <strong>2022</strong> among to date low-wage remains workers elevated and near in sectors 2021 levels. like Leisure and Hospitality.<br />
• How hazardous are short-tenured workers’ versus fulltenured<br />
the time workers’ of this average writing—about job tasks 50 million quits a<br />
What Quit is rates the jumped relative in injury the middle risk of for 2021 and remain high at<br />
short-tenured year, almost 10 workers? million more than pre-pandemic averages. For Many in-person workers service are sectors, new to their full-tenured jobs. Some workers of these are<br />
To measure are moving the effect from one of an similar influx of job short-tenured to another, workers but others usually are changing doing similar industries tasks or (or occupations. least similarly At the hazardous same<br />
on time, frequency, there we are must a large know number not only of new how remote many more workers. tasks) Many to people short-tenured left the office workers. at COVID’s For example, onset; nurses there in has<br />
short-tenured been a trickle workers back, there representing are, but also a massive how much change more in the hospitals amount and of nursing remote homes work compared and sales associates to before in the retail<br />
likely they are to sustain a workplace injury. Thus, we next stores typically perform similar job tasks at both short and<br />
pandemic.<br />
estimate the relative injury risk of short-tenured workers full tenure.<br />
and How full-tenured do such 4 workers. large changes in the labor market impact Conversely, workers compensation two sectors stand injury out frequency? in this chart <strong>The</strong> for magnitude having<br />
This of estimation these impacts uses two relies data on sources. the interaction of three factors: very atypical relative risks. <strong>The</strong>se are sectors which have an<br />
• Historical estimates of short-tenured worker shares especially strong relationship between worker tenure and<br />
taken • from How the much CPS more supplement or less likely on worker are short-tenured tenure work remote tasks typically workers performed to be injured by short- than other tenured workers? versus<br />
discussed • How in the much last has section. the share of such workers changed? full-tenured workers.<br />
• Annual • How estimates has the by sector mix of the of the share workforce of injured changed In Wholesale during the Trade, pandemic? short-tenured workers are nearly<br />
workers who have less than one year of tenure,<br />
published by the Bureau of Labor Statistics’ Survey of<br />
Occupational Injuries and Illnesses (SOII). 5<br />
<strong>The</strong>se data allow us to estimate how much more (or less)<br />
likely a short-tenured worker is to be injured than a fulltenured<br />
worker, assuming the two work similar number of<br />
work hours.6 <strong>The</strong> results are shown below.<br />
Short-tenured workers have a much higher injury frequency<br />
than their full-tenured counterparts, approximately twice<br />
as high or more in most sectors. Short-tenured workers’<br />
comparative injury frequency is not quite as high in several<br />
major in-person service sectors, including Leisure and<br />
Hospitality, Health Care and Social Assistance, and Retail<br />
Trade. Since these are on a full-time equivalent worker<br />
(FTE) basis, these relative risks assume the same number<br />
of hours worked per employee.<br />
<strong>The</strong> difference in relative risks between sectors illustrates<br />
16 THE BIG I VIRGINIA WINTER <strong>2022</strong>-<strong>23</strong><br />
three times more likely to suffer injury than full-tenured<br />
workers. This is strongly related to occupation. <strong>The</strong> two<br />
most common occupations within Wholesale Trade are<br />
salespersons and freight and stock movers. Sales activities<br />
in Wholesale Trade often require a lot of sector- specific<br />
knowledge, thus sales staff in the sector tend to be fulltenured.7<br />
Movers in Wholesale Trade are more likely to be<br />
short-tenured and have more physically demanding and<br />
hazardous jobs than the higher-tenured salespersons.<br />
Information is the only sector in which short-tenured<br />
workers are less likely to suffer injuries than full-tenured<br />
workers. Here, the relationship between tenure and<br />
hazardous occupations, so pronounced in Wholesale<br />
Trade, is reversed.<br />
Information is a mixture of disparate subsectors including<br />
publishing, motion pictures, data processing and hosting,<br />
and telecommunications. Among these subsectors,<br />
telecommunication workers—including equipment repairers<br />
and telecom line installers—have the highest median tenure<br />
and the highest share of hazardous occupations.<br />
Our relative risk measure comes with two caveats. First, the<br />
short-tenured share of injuries versus employment come<br />
from different sources, so there is potential for mismatch<br />
between the datasets. Second, there is no way to adjust<br />
for the fact that short-tenured workers within a sector often<br />
have different job tasks than full-tenured workers. Our<br />
result represents a combination of differences in injury rate<br />
for differing job duties (for workers of a similar tenure), as<br />
well as the tenure-driven differences in actual likelihood of<br />
injury for the same tasks.
Despite these limitations, these estimates are useful for this figure excludes those who already worked from home.<br />
getting<br />
Introduction<br />
a sense of how much an increase in short- tenured<br />
Remote worker share pulled back in 2021 to an average of<br />
workers may affect frequency. In sectors where shorttenured<br />
workers are twice as likely to be injured as full-<br />
<strong>The</strong> Great Reshuffle is reshaping the US labor market. Unemployment 16% across all sectors. is historically At the low, pandemic’s but labor onset, force virtually<br />
tenured participation workers, a is percentage still lower than point the increase pre-pandemic in the share rate. Labor anything shortages that could have be led done to remotely wage growth, was done especially remotely.<br />
As the initial wave of the pandemic passed, and especially<br />
of short-tenured strong among workers low-wage should workers be associated and in sectors with about like Leisure and Hospitality.<br />
once vaccines were introduced, workplaces began to<br />
a percentage point increase in the incidence rates. Any<br />
effect Quit will rates likely jumped be smaller in the for middle in-person of 2021 service and sectors, remain high reopen. at the time of this writing—about 50 million quits a<br />
especially year, almost Leisure 10 and million Hospitality, more than where pre-pandemic the historical averages. While Many the share workers of remote are new workers to their increased jobs. Some everywhere of these<br />
relative are moving injury risk from is much one lower similar than job 100%. to another, but others in are 2020, changing the largest industries concentration or occupations. was unsurprisingly At the same in<br />
office-based sectors. <strong>The</strong>se sectors are most amenable to<br />
time, there are a large number of new remote workers. Many people left the office at COVID’s onset; there has<br />
REMOTE WORKERS<br />
working from home. <strong>The</strong> graph above shows estimated<br />
been a trickle back, representing a massive change in the shares amount of remote of remote workers work using compared sector-level to before data for the both<br />
How pandemic. many remote workers are there?<br />
pre-pandemic shares of remote work and pandemicrelated<br />
remote work in 2020 and 2021. <strong>The</strong> greatest and<br />
<strong>The</strong> story for remote workers is much different than that<br />
for How short-tenured do such large workers. changes Short-tenured in the labor workers market have impact most workers lasting compensation increases came injury in Professional frequency? <strong>The</strong> and magnitude<br />
Business<br />
always of these accounted impacts for relies a substantial on the interaction portion of of the three labor factors: Services, Financial Activities, and Information. Nearly all<br />
force and the Great Reshuffle only moderately increased of these workers fall into the Office and Clerical workers<br />
their share. • How But the much share more of or remote less likely workers are short-tenured exploded compensation or remote workers class codes. to be injured than other workers?<br />
during the • pandemic. How much has the share of such workers changed?<br />
Even these large increases in remote workers due to the<br />
Before the • pandemic, How has the only sector about mix 6% of of the workers workforce worked changed pandemic during are the conservative pandemic? estimates of the total changes<br />
primarily from home. 8 During the pandemic, this in 2020 and 2021. <strong>The</strong> question from the CPS survey used<br />
percentage grew dramatically. An average of 26% of to create them asks whether an employee worked remotely<br />
people employed across all sectors worked from home due to the pandemic. This share will decline as workers<br />
because of the pandemic in April–December 2020 9 and return to reopened offices and other worksites. But it may<br />
also decline if employers adopt a more permanent workfrom-home<br />
arrangement.<br />
Respondents could still work remotely, but no longer<br />
consider the decision tied to the pandemic.<br />
<strong>The</strong> estimated share of remote workers can vary by<br />
survey depending on the exact definitions used, but the<br />
general picture that the pandemic supercharged remote<br />
work is clear:<br />
• A Pew report from a survey conducted in January<br />
<strong>2022</strong> concluded that among those whose job<br />
responsibilities can largely be done from home, 59%<br />
of workers primarily work remotely; but only 40% of<br />
Americans have such jobs. 10<br />
º This suggests about a quarter of Americans (59% x<br />
40%) still work remotely, only a little higher than the<br />
22% we estimate for 2021 (16% new remote workers<br />
due to the pandemic plus 6% already working from<br />
home pre-pandemic).<br />
• A Gallup survey reported that 25% of full-time workers<br />
worked entirely from home as of September 2021 and a<br />
further 20% worked from home at least 10% of the time. 11<br />
º <strong>The</strong> total of 45% is higher than the other survey<br />
results, but the Gallup survey includes all hybridremote<br />
and in-person workers and excludes parttime<br />
workers. 12<br />
WINTER <strong>2022</strong>-<strong>23</strong> THE BIG I VIRGINIA 17
We use the estimates from the CPS for two reasons. First, Code 8871 accounts for only 1% of payroll and 0.4% of<br />
we<br />
Introduction<br />
would like to interpret the share of remote workers on a premium within the Office and Clerical industry group in<br />
full-time equivalent basis. But what we can easily measure Policy Year 2018, as many telecommuters are not eligible<br />
<strong>The</strong> Great Reshuffle is reshaping the US labor market. Unemployment is historically low, but labor force<br />
is the share of workers who do at least some of their for this classification.<br />
work participation remotely. <strong>The</strong> is still CPS lower and than Pew the survey’s pre-pandemic conservative rate. Labor shortages have led to wage growth, especially<br />
While neither of these measures are perfect, they indicate<br />
estimates strong of among remote low-wage workers workers likely reflect and in more sectors workers like Leisure and Hospitality.<br />
that the relative risk for remote workers is lower than for<br />
who are fully or primarily remote. Using more expansive<br />
estimates, Quit rates like jumped Gallup’s, in that the include middle more of 2021 hybrid and workers, remain high on-site at the workers time of and this that writing—about the differential 50 million in relative quits risk a<br />
between remote and on-site workers is smaller than that<br />
without year, distinguishing almost 10 million primary more versus than occasional pre-pandemic remote averages. Many workers are new to their jobs. Some of these<br />
between short-tenured and full-tenured workers.<br />
workers, are moving could lead from us one to overstate similar job the to amount another, of remote but others are changing industries or occupations. At the same<br />
work time, being there done. are a large number of new remote workers. SCENARIO Many people left ANALYSIS: the office at COVID’s FREQUENCY onset; there has<br />
<strong>The</strong> been second a trickle reason back, is practical. representing <strong>The</strong> CPS a data massive has excellent change in the IMPACTS amount of BY remote SECTOR work compared to before the<br />
data pandemic. detail by sector. As with short-tenured workers,<br />
What is the net frequency effect of these combined<br />
variation in the amount of remote work being done in<br />
changes? And what will the pressures on frequency be as<br />
different How do sectors such is large important changes to understanding the labor market the degree impact<br />
the<br />
workers<br />
share<br />
compensation<br />
of short-tenured<br />
injury<br />
and remote<br />
frequency?<br />
workers<br />
<strong>The</strong><br />
continues<br />
magnitude<br />
to which of these incidence impacts rates relies in on each the sector interaction are likely of three to be factors:<br />
evolve? To illustrate these impacts, we present several<br />
affected.<br />
frequency scenarios for selected sectors.<br />
• How much more or less likely are short-tenured or remote workers to be injured than other workers?<br />
What is the relative injury risk<br />
In each sector, we estimate two long-term frequency<br />
for remote • How workers? much has the share of such workers changed?<br />
trends with data from 2011–2020. In these scenarios, we<br />
• How has the sector mix of the workforce changed<br />
Because remote work was rare until recently, there is very use during BLS incidence the pandemic? rates as our frequency measure, defined<br />
little direct data about the injury frequency of remote workers as the number of injury and illness cases requiring days<br />
versus on-site workers. However, for scenario analysis, we away from work per 10,000 FTE workers. We will discuss<br />
must make some estimate of the relative risk of remote other frequency metrics in the subsequent section about<br />
versus on-site workers. In this report, we select an estimate changes in the mix of workers.<br />
of –20% in every sector, meaning fully remote workers have<br />
20% fewer injuries than comparable on-site workers.<br />
This was selected judgmentally based on two sources.<br />
<strong>The</strong> first is SOII incidence rate data by sector for the years<br />
2011 to 2020. We use this sector-level data to estimate the<br />
relationship between the change in injury frequency and<br />
the change in the share of short-tenured workers and the<br />
share of remote workers, as well as a sector- specific longterm<br />
trend. <strong>The</strong> results generated a plausible range of<br />
relative risks between about –15% and –30%. Our selection<br />
of –20% is within this range.<br />
Remote work was uncommon before the pandemic.<br />
Consequently, most of the variation observed in remote work<br />
occurred in 2020. As 2020 was a very unusual year in many<br />
respects, the estimated range may change with future years<br />
of data. For this reason, we look for corroborating evidence<br />
that the selection of –20% is reasonable more generally.<br />
NCCI data on loss experience of pre-pandemic remote<br />
workers was also analyzed in making the –20% selection.<br />
Previous NCCI research, based on limited data, has<br />
shown that clerical telecommuting workers (Class Code<br />
8871) have lower average loss costs than clerical office<br />
employees (Class Code 8810), $0.05 to $0.07. 13 <strong>The</strong><br />
magnitude of this reduction aligns with our –20% estimate.<br />
However, this simple comparison has obvious limitations,<br />
most notably, the small size of losses and exposure. Class<br />
18 THE BIG I VIRGINIA WINTER <strong>2022</strong>-<strong>23</strong><br />
Injury rates have been declining for decades. Any impact<br />
of short-tenured or remote workers on injury rates should<br />
be measured relative to this long-term trend. <strong>The</strong>refore,<br />
we first estimate a pure time trend model. Second, we use<br />
all the information discussed in this report—the estimated<br />
historical share of short-tenured and remote workers,<br />
along with the estimated relative risks of such workers—to<br />
estimate a long-term frequency trend net of fluctuations in<br />
the share of short-tenured and remote workers.<br />
Using the latter method, we then consider two plausible<br />
paths for the evolving share of short-tenured or remote<br />
workers through 2025. We then plot the implied incidence<br />
rates along these two illustrative paths, as well as the path<br />
of incidence rates we estimate from the long-term trend<br />
that ignores these impacts.<br />
In all cases we use actual BLS incidence rates through 2020<br />
(excluding days away from work cases due to COVID- 19) 14<br />
and apply the model estimate for 2021 through 2025. We<br />
show paths for Leisure and Hospitality, Transportation and<br />
Warehousing, and Professional and Business Services to<br />
demonstrate the importance to frequency change of the<br />
various factors in our analysis.<br />
Leisure and Hospitality<br />
Leisure and Hospitality scenarios are shown in the figure<br />
below. Incidence rates for Leisure and Hospitality workers
fell sharply in 2020; a return to the long-term trendline (the matter, but not nearly enough to overwhelm Leisure and<br />
black Introduction<br />
dashed line) would result in an increase from 2020 Hospitality’s long-term trend.<br />
to 2021. Even so, the estimated 2021 incidence rate of<br />
<strong>The</strong> Great Reshuffle is reshaping the US labor market. Unemployment<br />
about 72 cases per 10,000 FTE workers would be below Transportation is historically and Warehousing low, but labor force<br />
pre-pandemic participation levels. is still lower than the pre-pandemic rate. Labor shortages have led to wage growth, especially<br />
Short-tenured workers are more impactful to Transportation<br />
strong among low-wage workers and in sectors like Leisure<br />
For 2021 and beyond, we consider two scenarios:<br />
and Warehousing and Hospitality. frequency than Leisure and Hospitality,<br />
since in this sector such workers are about twice as likely<br />
• Quit Orange: rates <strong>The</strong> jumped share in of the short-tenured middle of 2021 workers and remain the high at the time of this writing—about 50 million quits a<br />
to suffer a workplace injury than full- tenured workers. And<br />
year, sector almost remains 10 at million the 2021 more level than of 48% pre-pandemic through 2025averages. while Many the 2021 workers increase are new in short-tenured to their jobs. worker Some share of these in<br />
• are Blue: moving <strong>The</strong> share from of one short-tenured similar job to workers another, drops but by others 5 this are sector changing was industries not as large or as occupations. in Leisure and At Hospitality, the same it<br />
time, percentage there points are a in large <strong>2022</strong> number and 20<strong>23</strong> of and new by one remote additional workers. was Many still people significant. left the office at COVID’s onset; there has<br />
been point a in trickle 2024 and back, 2025, representing dropping to 36% a massive by 2025change in the Furthermore, amount of Transportation remote work compared and Warehousing to before has the much<br />
pandemic.<br />
higher incidence rates than Leisure and Hospitality, so even<br />
a similar change in relative risk will have a larger effect on<br />
How do such large changes in the labor market impact the workers total number compensation of injuries. injury frequency? <strong>The</strong> magnitude<br />
of these impacts relies on the interaction of three factors:<br />
Here, our illustrative scenarios are different:<br />
• How much more or less likely are short-tenured or • Orange: remote workers We assume to be the injured share than of other short-tenured workers?<br />
• How much has the share of such workers changed? workers in the sector remains at the 2021 level of 27%<br />
through 2025.<br />
• How has the sector mix of the workforce changed during the pandemic?<br />
• Blue: We assume that the share of short-tenured<br />
workers grows by two percentage points in <strong>2022</strong> and<br />
20<strong>23</strong> before leveling off in 2024 and 2025.<br />
In both scenarios, the estimated 2021 incidence rate is<br />
above the pure trend estimate. This is because the pure<br />
trend model does not incorporate short-tenured and<br />
remote worker shares at all, but the orange and blue<br />
scenarios do. Both scenarios show an uptick in 2021<br />
frequency due to the spike in short-tenured workers. 15<br />
<strong>The</strong>y diverge in later years.<br />
In the orange scenario, frequency declines roughly in<br />
parallel with the pure trend estimate. However, the<br />
frequency remains above the pure trend model because<br />
the short-tenured share stays high through 2025. In the<br />
blue scenario, the share of short-tenured workers declines<br />
over time, reducing expected frequency. Eventually, the<br />
benefit of remote work on injury rates becomes the bigger<br />
of the two impacts.<br />
Despite significant differences in assumptions, the orange<br />
and blue scenario outcomes are not too different. This<br />
follows from our estimate of relative risk. Short-tenured<br />
workers in Leisure and Hospitality are about one-third<br />
more likely to get injured than full-tenured workers, much<br />
less than most sectors. Even the dramatic 2021 change in<br />
short-tenured workers was only about 8 percentage points,<br />
and year-over-year scenario changes are much smaller<br />
than that. Scenario changes in short-tenured worker shares<br />
<strong>The</strong> orange scenario is the same as for Leisure and<br />
Hospitality: short-tenured share holds steady at 2021<br />
rates. But Transportation and Warehousing was a growing<br />
sector pre-pandemic and was in fact one of the only<br />
sectors whose share of short-tenured workers had been<br />
rising even before 2021. Thus, the blue scenario illustrates<br />
continued increases in short-tenured worker share. In both<br />
scenarios, higher shares of short-tenured workers lead to<br />
higher expected frequency than would be indicated by the<br />
pure trend model.16 In the scenario where Transportation<br />
and Warehousing’s short-tenured worker share continues<br />
to rise through 20<strong>23</strong>, incidence rates are much higher and<br />
do not fall back to the 2020 low until 2025.<br />
WINTER <strong>2022</strong>-<strong>23</strong> THE BIG I VIRGINIA 19
Professional and Business Services<br />
Frequency Impacts of Worker Mix Changes<br />
<strong>The</strong> Introduction<br />
pandemic’s main effect on Professional and Business <strong>The</strong> discussion thus far has focused on the share of shorttenured<br />
and remote is historically workers by low, sector but labor and their force relative<br />
Services <strong>The</strong> Great was a Reshuffle dramatic rise reshaping remote work. the US Our labor scenarios market. Unemployment<br />
for participation this sector focus is still on lower changes than in the pre-pandemic share of remote rate. Labor risks. But shortages another have effect led of to the wage pandemic growth, was especially a change in<br />
workers<br />
strong<br />
rather<br />
among<br />
than<br />
low-wage<br />
the share of<br />
workers<br />
short-tenured<br />
and in sectors<br />
workers.<br />
like Leisure the mix and of Hospitality. business. What net frequency effect would we<br />
As we have shown, the share of remote work expanded expect to see from all three types of change together—<br />
rapidly Quit in rates 2020 jumped due to in the the pandemic. middle of 2021 While and the remain share high share at the of short-tenured time of this writing—about workers, share of 50 remote million workers, quits a<br />
partially year, receded almost 10 in 2021, million it more remained than dramatically pre-pandemic higher averages. and changing Many workers industry are mix—at new to an their aggregated jobs. Some level of for these an<br />
than pre-pandemic. It is not clear what to expect going entire state or representative book of business?<br />
are moving from one similar job to another, but others are changing industries or occupations. At the same<br />
forward, time, as there some are companies a large number push for of a return new remote to the office workers. <strong>The</strong> Many first people two effects left the act office in opposite at COVID’s directions. onset; Upward there has<br />
and others have made flexible or fully- remote options pressure on frequency from more short-tenured workers<br />
been a trickle back, representing a massive change in the amount of remote work compared to before the<br />
permanent. Our scenarios allow for the possibility that is partially balanced by the downward pressure from<br />
remote pandemic. work share may move in either direction in the next more remote work. While the magnitude of each of these<br />
few years.<br />
How do such large changes in the labor market impact<br />
effects<br />
workers<br />
depends<br />
compensation<br />
on the mix<br />
injury<br />
of<br />
frequency?<br />
business, most<br />
<strong>The</strong><br />
states<br />
magnitude<br />
will<br />
• Orange: <strong>The</strong> share of remote workers increases from have similar effects because the industry mix of the labor<br />
of these impacts relies on the interaction of three factors:<br />
42% in 2021 to 54% in 20<strong>23</strong>, which was the 2020 high market is similar in most states. 17 For insurance carriers,<br />
in remote • How worker much share, more or and less stays likely at are that short-tenured level in either<br />
or remote<br />
effect may<br />
workers<br />
dominate<br />
to be<br />
if<br />
injured<br />
they primarily<br />
than other<br />
write<br />
workers?<br />
policies<br />
subsequent years.<br />
in certain sectors of the economy.<br />
• How much has the share of such workers changed?<br />
• Blue: <strong>The</strong> share of remote workers continues its 2021 But what is the frequency effect from the change in mix<br />
• How has the sector mix of the workforce changed during the pandemic?<br />
decline each year through 2025, although never falling itself? We can break this question down into two parts.<br />
all the way back to pre-pandemic levels.<br />
How did the mix change? And what is the frequency metric<br />
being used? 18<br />
As in the case of Leisure and Hospitality, differences in<br />
incidence rates are modest. <strong>The</strong> orange scenario has<br />
about 28 cases per 10,000 FTE workers by 2025, compared<br />
to 30 per 10,000 FTE workers in the blue Scenario. Two<br />
scenario paths bracket the path for the pure trend model,<br />
suggesting that trends in incidence rates for office and<br />
clerical workers depend on how many such workers return<br />
to on-site work. This industry group accounts for 60% of<br />
workers compensation payroll and 11% of premium.<br />
<strong>The</strong>se scenario effects depend on our working estimate of<br />
a –20% relative risk for remote workers, which is subject to<br />
refinement as we learn more about remote work, and as<br />
workers and the workers compensation system adapt to<br />
the increased prevalence of the home office.<br />
20 THE BIG I VIRGINIA WINTER <strong>2022</strong>-<strong>23</strong><br />
To illustrate why the choice of metric is important, consider<br />
the example of roofers. Because roofing is more hazardous<br />
than most jobs, it has high injury frequency measured<br />
per worker or per payroll. Average injuries are also more<br />
severe. Workers compensation losses are determined by<br />
the likelihood of injury and the average severity: it takes<br />
a smaller number of high-severity injuries to generate<br />
the same amount of losses. Loss costs are a component<br />
used to determine final premium rates. Thus, high-severity<br />
classes have lower frequency per premium than lowseverity<br />
classes, even classes such as roofing that have<br />
high frequency per payroll.<br />
Both the magnitude and the direction of the mix effect<br />
on frequency during the pandemic differ depending on<br />
these considerations. To demonstrate this, we use 2019 to<br />
2021 employment changes by sector for two sample states<br />
and show the estimated effects of changes to the share of<br />
short-tenured workers, the share of remote workers, and<br />
industry mix on frequency per premium and per payroll.<br />
This graph shows the two states’ change in employment.<br />
<strong>The</strong> first two bars for each sector reflect percent change in<br />
employment from 2019 to 2020 and 2020 to 2021. <strong>The</strong> third<br />
darker bar shows the cumulative employment change from<br />
2019 to 2021. Over the two-year period:<br />
• State 1 experienced a large net employment loss in<br />
Leisure and Hospitality jobs and a large net gain in<br />
Transportation and Warehousing.
in Transportation and Warehousing employment. Recall<br />
Introduction<br />
that Transportation and Warehousing incidence rates per<br />
worker are more than twice as high as those in Leisure and<br />
<strong>The</strong> Great Reshuffle is reshaping the US labor market. Unemployment is historically low, but labor force<br />
Hospitality.<br />
participation is still lower than the pre-pandemic rate. Labor shortages have led to wage growth, especially<br />
Worker payroll is determined by the number of workers<br />
strong among low-wage workers and in sectors like Leisure and Hospitality.<br />
and their average pay. Transportation and Warehousing<br />
Quit rates jumped in the middle of 2021 and remain high workers at the have time higher of this hourly writing—about pay than Leisure 50 million and Hospitality quits a<br />
workers, but not nearly twice as high. <strong>The</strong>refore, like<br />
year, almost 10 million more than pre-pandemic averages. Many workers are new to their jobs. Some of these<br />
incidence rates per FTE worker, injury frequency per<br />
are moving from one similar job to another, but others are changing industries or occupations. At the same<br />
payroll is much higher in Transportation and Warehousing<br />
time, there are a large number of new remote workers. than Many Leisure people and left Hospitality. the office Thus, at COVID’s the shift onset; in industry there mix has<br />
been a trickle back, representing a massive change in the pushes amount frequency of remote up. This work upward compared pressure to before is shown the by<br />
pandemic.<br />
the blue bar for industry mix.<br />
• State 2 experienced the largest employment losses in However, Transportation and Warehousing injuries<br />
How Leisure do and such Hospitality large changes as well in as the meaningful labor market losses impact in workers compensation injury frequency? <strong>The</strong> magnitude<br />
have higher average severity than those in Leisure and<br />
of Construction these impacts and relies Manufacturing. on the interaction of three factors: Hospitality. Recall that high severity classes have low<br />
º In State 2, Transportation and Warehousing frequency per premium, whether or not they have high<br />
• How much more or less likely are short-tenured or remote workers to be injured than other workers?<br />
employment was stable rather than increasing. frequency per worker or per payroll. Thus, the shift to<br />
• How much has the share of such workers changed? Transportation and Warehousing (a high-severity class)<br />
What was the effect on frequency? In the chart below, we<br />
• How has the sector mix of the workforce changed puts during downward the pandemic? pressure on frequency per premium,<br />
break out impacts on each state from each of the three<br />
shown by the orange bar.<br />
channels, both on a per payroll and per premium basis.<br />
What happens when we put all three effects together? <strong>The</strong><br />
<strong>The</strong> impacts of short-tenured and remote workers are of<br />
impacts of short-tenured workers and remote workers do<br />
similar magnitudes in the two states because the states’<br />
not depend on the choice of frequency measure. More<br />
overall mix of business is broadly similar (in pre-pandemic<br />
short-tenured workers will always push frequency up and<br />
levels, not in the changes experienced during the<br />
more remote workers will always push frequency down.<br />
pandemic). Thus, we see the size of the blue bar for shorttenured<br />
workers for State 1 is similar to the size of the blue<br />
Only the impact of mix changes can differ based on the<br />
selected metric.<br />
bar for short-tenured<br />
workers for State 2. <strong>The</strong><br />
same holds for crossstate<br />
<strong>The</strong> magnitude of the<br />
first two effects depends<br />
comparisons of<br />
on our estimates of<br />
the two orange bars for<br />
how many more shorttenured<br />
and remote<br />
short-tenured workers,<br />
as well as for both the<br />
workers there are and<br />
blue and orange pair of<br />
on such workers’ relative<br />
bars for remote workers.<br />
risks. <strong>The</strong> size of the<br />
bars show that in both<br />
Within each state, the<br />
State 1 and State 2, we<br />
blue and orange bars<br />
estimate the magnitude<br />
for short-tenured and remote workers are identical to each<br />
of the upward pressure from more short-tenured workers<br />
other. This occurs because that part of our calculation is<br />
is about the same size as the downward pressure from<br />
meant to isolate the change in incidence rates due to<br />
remote workers.<br />
changes in short-tenured or remote workers for the state’s<br />
pre-pandemic mix of business.<br />
Because these effects are partially offsetting, the impact of<br />
mix changes play a large role in our estimate of the total<br />
<strong>The</strong> effect of industry mix is the third element. Here the<br />
effect on aggregate frequency. In State 1, the growth in<br />
chart shows that frequency change depends critically on<br />
Transportation and Warehousing and decline in Leisure<br />
both the state’s experience and choice of metric.<br />
and Hospitality leads to a slightly upwards total effect<br />
<strong>The</strong> first panel of the chart shows the frequency change for<br />
State 1. Here the most important mix shifts were a decline<br />
in Leisure and Hospitality employment and an increase<br />
on frequency when measured per payroll. <strong>The</strong> combined<br />
increase due to short-tenured and sector mix effects is<br />
slightly larger than the downward pressure from more<br />
WINTER <strong>2022</strong>-<strong>23</strong> THE BIG I VIRGINIA 21
emote work. But the net impact on a premium basis is for on-site workers. Remote work was widespread at the<br />
downwards<br />
Introduction<br />
because the changing mix toward high severity onset of the pandemic, but the largest and most lasting<br />
classes in Transportation and Warehousing puts downward increases in remote work have been in the office-based<br />
<strong>The</strong> Great Reshuffle is reshaping the US labor market. Unemployment is historically low, but labor force<br />
pressure on frequency per premium.<br />
sectors Professional and Business Services, Financial<br />
participation is still lower than the pre-pandemic rate. Labor<br />
In State 2, the large employment decline in the low Activities, shortages and Information. have led to wage growth, especially<br />
strong among low-wage workers and in sectors like Leisure and Hospitality.<br />
frequency per payroll sector of Leisure and Hospitality<br />
Changing industry mix<br />
roughly offsets the declines in high frequency per payroll<br />
Quit rates jumped in the middle of 2021 and remain high at the time of this writing—about 50 million quits a<br />
sectors Construction and Manufacturing. <strong>The</strong> tiny blue <strong>The</strong> impacts from industry mix changes are more varied.<br />
year, almost 10 million more than pre-pandemic averages.<br />
bar indicates a small net impact of mix on frequency In both Many sign workers and magnitude, are new to frequency their jobs. effects Some from of these mix<br />
per are payroll. moving <strong>The</strong> from net impact one similar of all job three to another, effects is but slightly others change are changing depend industries critically on or both occupations. the nature At of the changes same<br />
downwards. time, there However, are a large Construction number and of new Manufacturing remote workers. are and Many the people choice of left frequency the office metric. at COVID’s All states onset; lost there a lot of has<br />
high-severity been a trickle classes back, like representing Transportation a and massive Warehousing, change in the Leisure amount and of Hospitality remote work jobs during compared the pandemic, to before but the the<br />
and thus they have low frequency per premium. <strong>The</strong> loss of total mix effect on a state (or an insurer’s book of business)<br />
pandemic.<br />
jobs in these sectors puts significant upwards pressure on depends on what happened in other sectors.<br />
frequency How do per such premium, large changes illustrated in the by the labor orange market bar impact for For workers example, compensation a shift from injury Leisure frequency? and Hospitality <strong>The</strong> magnitude to<br />
State of 2—the these impacts opposite relies sign as on in the State interaction 1. of three factors: Transportation and Warehousing employment puts<br />
<strong>The</strong>se two examples demonstrate the complex nature of upward pressure on frequency per worker or per payroll<br />
the overall • frequency How much impacts more of or the less Great likely Reshuffle, are short-tenured as well but or downward remote workers pressure to on be frequency injured than per premium. other workers? When<br />
as the need • How for researchers much has the and share practitioners of such to workers carefully changed? Construction and Manufacturing employment declines<br />
understand • How their has change the in sector mix relative mix of the to their workforce intended changed along during with the Leisure pandemic?<br />
Hospitality, as in our State 2<br />
measurement before analyzing frequency impacts of example, frequency per payroll is barely affected, but<br />
mix changes. NCCI will continue to analyze industry mix there is sharp upward pressure on frequency per premium.<br />
changes and the impact on frequency and severity.<br />
CONCLUSION<br />
FINDINGS AND CONCLUSIONS<br />
<strong>The</strong>se frequency effects are probably short-term anomalies.<br />
Three aspects of the Great Reshuffle have important <strong>The</strong> Great Reshuffle is a unique event, following the largest<br />
implications for workers compensation frequency:<br />
and most sudden decline in employment ever to strike the<br />
• More short-tenured workers<br />
US labor market. Some industry mix changes are likely<br />
to be permanent, such as a lower employment share in<br />
• More remote workers<br />
Leisure and Hospitality and a greater concentration of<br />
• Changing industry mix<br />
remote work. However, the rate of change in short-tenured<br />
workers, remote workers, or industry mix will not be as<br />
large in <strong>2022</strong> or any future year as the sweeping changes<br />
during 2020 and 2021.<br />
More short-tenured workers<br />
<strong>The</strong> increase in short-tenured workers puts upward<br />
pressure on injury frequency. While the increased share<br />
of short-tenured workers has been modest, their relative<br />
risk compared to full-tenured workers is high. Sectors<br />
with both a large increase in short-tenured workers and a<br />
high relative risk for such workers experienced the largest<br />
impacts, especially Transportation and Warehousing.<br />
Short-tenured worker share grew the most in Leisure<br />
and Hospitality, but its impact was muted because shorttenured<br />
workers’ relative risk in the sector is less than<br />
average. In office-based sectors, there has not been much<br />
change in short-tenured worker share.<br />
More remote workers<br />
Increased remote work puts downward pressure on injury<br />
frequency. <strong>The</strong> share of remote workers rose dramatically<br />
from pre-pandemic levels, but our selected estimate of<br />
remote workers’ relative risk is not much lower than that<br />
22 THE BIG I VIRGINIA WINTER <strong>2022</strong>-<strong>23</strong><br />
Through midyear <strong>2022</strong>, new hire rates remain high, indicating<br />
that the share of short-tenured workers has stayed near<br />
2021 levels. Eventually, hiring will slow down, but this return<br />
to normal will be a gentle decline compared to the huge<br />
shocks from pandemic layoffs and subsequent rehiring<br />
during the Great Reshuffle. This lesser rate of change will<br />
have correspondingly smaller frequency impacts.<br />
Our Transportation and Warehousing scenarios provide<br />
examples of how frequency effects can still be substantial<br />
in sectors where short-tenured workers have relatively<br />
high injury rates and their share continues to rise. This is<br />
especially relevant to a book of business that emphasizes<br />
new or growing firms.<br />
Remote work will likely never fall back to pre-pandemic<br />
levels and no changes in remote work will be as large or<br />
rapid as the explosion of remote work in 2020. A large
percentage of jobs that are conducive to remote work <strong>The</strong>se labor market changes during the Great Reshuffle<br />
are<br />
Introduction<br />
now being done remotely and many workers and will continue to impact workers compensation frequency.<br />
employers have embraced this flexibility. Remote work But any further ripples are expected to come from smaller<br />
<strong>The</strong> Great Reshuffle is reshaping the US labor market. Unemployment is historically low, but labor force<br />
will continue to be important to office and clerical sectors, year-to-year labor market changes than what we have<br />
as some participation firms continue is still to lower expand than remote the pre-pandemic or hybrid-work rate. Labor already shortages seen and have are led unlikely to wage to have growth, major especially effects on<br />
options strong and among others low-wage return to the workers office. and It will in be sectors important like Leisure long-term and Hospitality. frequency trends.<br />
to obtain better estimates of the relative risk of remote and<br />
on-site Quit workers rates jumped as employees, in the middle firms, and of 2021 insurers and get remain used high at the time of this writing—about 50 million quits a<br />
to remote year, almost work. 10 million more than pre-pandemic averages. Many workers are new to their jobs. Some of these<br />
are moving from one similar job to another, but others are changing industries or occupations. At the same<br />
time, there are a large number of new remote workers. Many people left the office at COVID’s onset; there has<br />
been a trickle back, representing a massive change in the amount of remote work compared to before the<br />
pandemic. ACKNOWLEDGEMENTS<br />
<strong>The</strong> author would like to thank Len Herk, Carolyn Wise, Shawn Adcock, Kevin Fernes, Francesco Renna, and<br />
How Barry do Lipton such for large important changes contributions in the labor to market this study. impact workers compensation injury frequency? <strong>The</strong> magnitude<br />
of these impacts relies on the interaction of three factors:<br />
• How much more or less likely are short-tenured or remote workers to be injured than other workers?<br />
• How much has the share of such workers changed?<br />
• How has the sector mix of the workforce changed during the pandemic?<br />
ENDNOTES<br />
1<br />
We show this series from 1996 through 2018 in How Do Recessions Affect Workers Compensation? NCCI, October 16, 2019.<br />
2<br />
We discuss this for the case of auto manufacturing in our Supply Chain Disruptions and <strong>The</strong>ir Employment Impacts, With Case Studies for<br />
Residential Construction and Auto Manufacturing, NCCI, December 13, 2021.<br />
3<br />
Data based on the January <strong>2022</strong> survey will be released later this year (<strong>2022</strong>), but even then we will need to rely on estimates created in part<br />
from other sources, as there will be no direct data on the share of short-tenured workers between January 2020 and <strong>2022</strong>.<br />
4<br />
In this brief, we use the term “full-tenured” to mean all workers with at least one year at their current employer – the opposite of short-tenured.<br />
5<br />
<strong>The</strong> relative risks reported here are calculated from 2018 worker shares and injuries by tenure. We did similar calculations for each year from<br />
2011–2020 and found broadly similar relative risks across the whole period in terms of magnitudes and also differentials between different<br />
sectors.<br />
6<br />
We also collect hours worked from the CPS microdata, downloaded from IPUMS-CPS, to put worker shares in terms of full- time equivalent<br />
(FTE) workers. This is an important adjustment because short-tenured workers are more likely than full- tenured workers to work part-time.<br />
7<br />
This is in sharp contrast to retail sales workers, who have the second-highest concentration of short-tenured workers of any sector, behind<br />
only Leisure and Hospitality.<br />
8<br />
An in-depth discussion of how remote workers are defined and measured can be found in Remote Work Before, During, and After the<br />
Pandemic, NCCI, January 25, 2021.<br />
9<br />
This is calculated from a COVID-19 Supplement to the Current Population Survey.<br />
10<br />
COVID-19 Pandemic Continues to Reshape Work in America, February 16, <strong>2022</strong>, Pew Research Center.<br />
11<br />
Remote Work Persisting and Trending Permanent, October 13, 2021, Gallup.<br />
12<br />
Part-time workers are more likely to have jobs that require in-person work in sectors such as Leisure and Hospitality or Retail Trade.<br />
13<br />
Telecommuting and Workers Compensation: What We Know, NCCI, January 25, 2021.<br />
14<br />
Specifically, we exclude “exposure to harmful substances and environment” cases in all years as a proxy for COVID-19 cases. This category<br />
was responsible for only about 4 cases per 10,000 FTE workers in each year from 2011–2019, but 43.5 cases per 10,000 workers in 2020.<br />
15<br />
<strong>The</strong>re is slight upward pressure on frequency between 2020 and 2021 from a partial return to office of 2020 remote workers, but since Leisure<br />
and Hospitality has a high degree of in-person work and a low share of remote workers, the impact is small. This sector scenario is primarily<br />
about short-tenured worker shares.<br />
16<br />
As for Leisure and Hospitality, the 2020 to 2021 change also reflects minor impacts from the changing share of remote workers.<br />
17<br />
We break down pre-pandemic employment by state in our 2019 Q4 Quarterly Economics Briefing, Employment and Wage Growth by State<br />
and Economic Sector, NCCI, January 9, 2020.<br />
18<br />
NCCI primarily uses frequency per premium in ratemaking, but frequency is also calculated per payroll or per worker. <strong>The</strong> choice of frequency<br />
metric and differences between the various measures are discussed at length in NCCI Explains Its Top 3 Frequency Measures, NCCI, October<br />
15, 2018.<br />
WINTER <strong>2022</strong>-<strong>23</strong> THE BIG I VIRGINIA <strong>23</strong>
24 THE BIG I VIRGINIA WINTER <strong>2022</strong>-<strong>23</strong>
dreamstime.com/dedekk<br />
THINGS WE THINK<br />
YOU SHOULD KNOW<br />
ABOUT THE IIAV<br />
“We asked some of the staff here at IIAV what they think the more<br />
underutilized resources that our association offers are, things you might not<br />
know but we think you absolutely should. Here is what they had to say!<br />
“While there is so very much that IIAV does to help<br />
our members, one item to remember is that IIAV and<br />
our staff are a resource or extension of the agency for<br />
research and assistance. If you are working on an issue<br />
or have a problem associated with the agency and<br />
need some help … Call IIAV! Our staff knows who and<br />
where to call to get answers to your question.”<br />
— Bob Bradshaw,<br />
President & CEO<br />
“Agents are always looking for ways to maximize their<br />
marketing budget. As an IIAV member you have access<br />
to Trustedchoice.org which allows you to enhance your<br />
branding and name recognition by utilizing the Trusted<br />
Choice logo. It also offers the opportunity for co-op<br />
advertising funds.”<br />
— Don Bragg,<br />
Director of Membership/Marketing<br />
“Having been here for such a short time this is a<br />
tough question. Having said that, many agencies<br />
may not know that as members they have access to<br />
risk management tools that can help reduce and even<br />
eliminate exposures in their agency. <strong>The</strong>y can visit<br />
our website to find technical bulletins on an array of<br />
subjects, or even access “ask an expert.” You can find<br />
these under the ‘resources’ link on our website.”<br />
— Lisa Harmon,<br />
COO<br />
“Do you have a topic you want your agents to know<br />
more about? IIAV can develop a class just for your<br />
needs. We love to provide in-house learning for our<br />
members. We are here to help with all your learning<br />
needs, including on-boarding, pre-licensing, sales<br />
training, and continuing education. We provide many<br />
choices and platforms to learn, including, in-person,<br />
virtual and on-demand options. Please let us know<br />
what your educational needs may be. We are here to<br />
help you grow!”<br />
— Debbi Little,<br />
Director of Professional Development and Programs<br />
“<br />
“Are you an employer in the insurance industry looking<br />
for the right fit? Or are you looking for a career change<br />
within the insurance industry? IIAV has our very own<br />
career board, and it’s an excellent opportunity for<br />
anyone seeking either employees or employers. IIAV’s<br />
Career Board is the destination for those interested in<br />
a career in the insurance industry.”<br />
— Grant Brewer,<br />
Communications & Graphic Design Manager<br />
WINTER <strong>2022</strong>-<strong>23</strong> THE BIG I VIRGINIA 25
IRV METHODOLOGIES,<br />
REPLACEMENT COST<br />
iStockphoto.com/Olivia Rich<br />
AND<br />
RECONSTRUCTION COST<br />
By Chris Boggs<br />
Determining a structure’s insurance<br />
replacement value (IRV) is not complicated.<br />
Very few viable methodologies are available<br />
to develop an IRV. Any complications in<br />
calculating the IRV arise only because<br />
there are multiple sources for each option. Once the<br />
methodology and source are chosen, estimating the IRV is<br />
relatively simple.<br />
Although not complicated, developing and applying<br />
the correct IRV within the property insurance policy<br />
does not guarantee payment of the structure’s entire<br />
reconstruction cost following a major loss. Key provisions<br />
within the “standard,” unaltered commercial property<br />
policy (CPP) preclude payment of certain costs and<br />
expenses. <strong>The</strong> realities of “replacement cost” within the<br />
insurance policy can leave a large payment gap between<br />
the amount paid by the insurance policy and the cost to<br />
reconstruct the structure.<br />
<strong>The</strong> unexpected results of COVID have also created<br />
a problem. Not only must the realities of replacement<br />
cost and reconstruction cost be understood, but supply<br />
chain issues have increased the cost of construction and<br />
reconstruction. <strong>The</strong> cost to reconstruct may be abnormally<br />
high for the foreseeable future.<br />
ADJUSTMENT OF A<br />
MAJOR PROPERTY LOSS<br />
“Replacement cost” is a fundamentally misunderstood<br />
concept. Unfortunately, the insurance industry may be<br />
primarily to blame for these misconceptions.<br />
Over time, the insurance industry and its representatives<br />
have explained replacement cost to mean new stuff in<br />
place of old stuff. While there is a grain of truth in this<br />
description, this oversimplification of replacement cost<br />
has led to an expectation that is not supported by the<br />
policy language.<br />
Replacement cost coverage provided by the “standard,”<br />
unendorsed CPP pays ONLY for the part of the structure<br />
damaged by a covered cause of loss. Beyond providing<br />
coverage for ONLY the damaged part of the structure,<br />
the unendorsed CPP pays ONLY the amount necessary<br />
to rebuild the damaged structure back to its original<br />
condition using materials of like kind and quality (LKQ).<br />
<strong>The</strong>se two ONLYs represent the key differences between<br />
the reality of replacement cost and the expectation of<br />
reconstruction cost following a major loss to the insured<br />
structure. <strong>The</strong> CPP pays:<br />
• ONLY to repair or rebuild the damaged part of the<br />
structure; and<br />
• ONLY to return the damaged part to its original<br />
condition and state regardless of building codes.<br />
A large property loss, if not total, exposes the<br />
shortcomings of replacement cost coverage. Following a<br />
major property loss, the building codes applicable to the<br />
damaged structure may disallow repair and may require<br />
the destruction of the undamaged portion of the building.<br />
None of the expense associated with the loss in value of,<br />
the demolition of and the removal of the undamaged<br />
portion is paid under a replacement cost policy.<br />
Additionally, no building can be rebuilt out of compliance<br />
with the applicable building code. Replacement cost<br />
coverage specifically excludes any additional costs<br />
necessary to bring the building into compliance with the<br />
26 THE BIG I VIRGINIA WINTER <strong>2022</strong>-<strong>23</strong>
uilding code. A replacement cost policy pays only to put<br />
back what was damaged and no more.<br />
A March 2021 New Hampshire Supreme Court ruling<br />
serves as a prime example of the issues with replacement<br />
cost in contrast to reconstruction cost. In 101 Ocean Blvd.<br />
LLC v. Foy Insurance Group Inc., Ocean Boulevard Hotel<br />
in Hampton, N.H. obtained a $2 million replacement<br />
cost policy that provided $10,000 in ordinance or law<br />
insurance coverage.<br />
In October 2015, a fire severely damaged the hotel. <strong>The</strong><br />
insured was told the cost to replace the existing structure<br />
would be about $1.1 million and rebuilding it in compliance<br />
with the current building code would cost an additional<br />
$905,070. This is just slightly more than the $2 million<br />
replacement cost coverage purchased.<br />
<strong>The</strong> insured decided to demolish the structure rather than<br />
rebuild it. After accounting for depreciation, the insurer paid<br />
Ocean $910,141 for the structure’s replacement cost, which<br />
did not include the additional cost necessary to rebuild<br />
the structure in compliance with the building code.<br />
Although the insured had sufficient “replacement cost”<br />
coverage ($2 million), the reality of replacement cost in<br />
the unendorsed policy cost the insured (and ultimately<br />
the agent) $905,070. This is not an isolated incident; in<br />
conversations with insurance agent’s errors and omissions<br />
(E&O) insurance carriers, insufficient or improper<br />
explanation of replacement cost is a common error.<br />
“Replacement cost” does not pay what many have<br />
been led or conditioned to believe. Couple the reality<br />
of replacement cost with the fact that the requirements<br />
found in building codes have the potential to turn a partial<br />
loss into a total loss, and it becomes abundantly clear that<br />
replacement cost is insufficient following a major property<br />
loss. Reconstruction cost is the goal.<br />
• <strong>The</strong> undamaged part of the structure can be repaired;<br />
or<br />
• <strong>The</strong> undamaged part of the structure cannot be<br />
repaired and must be demolished and removed.<br />
Regardless which directive is given, the entire structure<br />
must be brought into compliance with current building<br />
code. Replacement cost, as has been demonstrated, does<br />
not pay these necessitated additional costs.<br />
Achieving reconstruction cost requires endorsements be<br />
attached to the commercial property policy. Specifically,<br />
Ordinance or Law coverage should be attached to every<br />
commercial property policy.<br />
Ordinance or law coverage is the primary step (not the<br />
only step) towards turning a “replacement cost” policy<br />
into “reconstruction cost” coverage. <strong>The</strong> CPP and the<br />
Ordinance or Law coverage dovetail following a “major<br />
loss” to get closer to accomplishing reconstruction<br />
cost. Following is an example demonstrating how these<br />
coverages work towards reconstruction cost.<br />
Undamaged Part –<br />
12,000 Sq. Ft.<br />
CPP Pays:<br />
• Cost to Remove the Debris of Damaged Part<br />
• Cost to Rebuild Damaged Part “as-is”<br />
FIRE DAMAGE –<br />
13,000 Square Feet<br />
1 Story – 25,000 square feet – Manufacturer – 15 Years Old – 12 Month POR<br />
Ordinance or Law (CP 04 05) Pays:<br />
• Value of Undamaged Portion (Cov. A)<br />
• Cost to to Remove Debris of Undamaged Portion (Cov. B)<br />
• Increased Cost to Rebuild ENTIRE Structure to Current Building Code (Cov. C)<br />
RECONSTRUCTION COST<br />
Rarely does a structure suffer a total loss, partial losses are<br />
statistically more likely. If the amount of damage in a partial<br />
loss situation crosses a specific threshold the building is<br />
judged to have suffered “major damage.” <strong>The</strong> meaning<br />
of “major damage” varies by state and may even vary by<br />
jurisdiction within a given state.<br />
Because there is no one countrywide definition or<br />
application of “major damage,” this concept cannot be<br />
detailed in this paper; only the results of what occurs when<br />
crossing the “major damage” threshold<br />
can be described in this report.<br />
When damage crosses the “major<br />
damage” threshold, the relevant<br />
building code official gives one of two<br />
directives regarding the undamaged<br />
portion of the building:<br />
Note that this is a partial loss that may become a total loss<br />
based on the application of the current building code. <strong>The</strong><br />
jurisdictional building code official’s directive will likely<br />
turn this into a total loss by requiring the entire building be<br />
brought into compliance with the current building code.<br />
Which policy/endorsement pays which part of the loss?<br />
Lacking ordinance or law coverage, the only payment<br />
owed by a replacement cost policy is the amount in blue.<br />
<strong>The</strong> ordinance or law policy pays the amounts in red and<br />
green. Reconstruction cost can be achieved only when<br />
Ordinance or Law: Increased Cost of Construction<br />
Ordinance or Law: Cost to Remove the Debris<br />
of the Undamaged Portion of the Building<br />
Ordinance or Law: Value of the Undamaged<br />
Portion of the Building<br />
CPP: Cost to Remove the Debris of the<br />
Damaged Portion of the Building<br />
CPP: Cost to Rebuild the Damaged<br />
Portion of the Building<br />
WINTER <strong>2022</strong>-<strong>23</strong> THE BIG I VIRGINIA 27
all costs are covered by the CPP coupled the necessary<br />
Ordinance or Law and other endorsements.<br />
ORDINANCE OR LAW COVERAGE<br />
“Standard” Ordinance or Law endorsements (such as the<br />
CP 04 05 promulgated by Insurance Services Office (ISO))<br />
contains three coverage parts:<br />
• Coverage A pays the value of the undamaged portion<br />
of the building;<br />
• Coverage B pays the amount necessary to tear down<br />
and remove the debris of the undamaged portion of<br />
the building; and<br />
• Coverage C pays the increased cost to bring the entire<br />
building (damaged and undamaged) into compliance<br />
with the current building code.<br />
Coverages A and B focus on and pay for the undamaged<br />
part of the building for one key reason – the property<br />
policy pays replacement cost to cover only those costs<br />
associated with the damaged part of the building. Only by<br />
endorsing these coverage parts onto the policy are these<br />
expenses covered.<br />
Coverage C applies to the entire building, damaged and<br />
undamaged. For the damaged portion of the building,<br />
Coverage C pays the difference between replacement<br />
cost and the cost to rebuild in compliance with the current<br />
building code. For the undamaged section of the structure,<br />
Coverage C pays the difference between Coverage A and<br />
the cost to bring that part of the building into compliance<br />
with building codes.<br />
Proprietary ordinance or law endorsements may apply<br />
different coverage parts. Rather than “Coverage A,”<br />
the policy may simply state, “Value of the Undamaged<br />
Portion.” Regardless how delineated, ordinance or law<br />
coverage generally provides these three coverage parts.<br />
COST OF ORDINANCE OR<br />
LAW COVERAGE<br />
When ordinance or law is endorsed onto a commercial<br />
property policy, as is common with all endorsements, an<br />
additional premium is required. <strong>The</strong> relative “cost” of an<br />
ordinance or law endorsement is low compared to the outof-pocket<br />
costs that may be suffered when it is not present.<br />
Coverage for the Value of the Undamaged Portion increases<br />
the building part of the property premium about 15%.<br />
<strong>The</strong> same rate applicable to the building coverage applies<br />
to Coverages B and C (debris removal and increased cost<br />
of construction).<br />
Let’s apply these costs to the building in the New Hampshire<br />
case briefed above. Because assumptions must be made<br />
regarding construction and protection to estimate a rate,<br />
for this example, the estimated rate is $0.50 per $100. <strong>The</strong><br />
resulting premium at this rate is $10,000 for $2 million or<br />
replacement cost coverage.<br />
Value of the undamaged portion increases the premium<br />
approximately $1,500.<br />
<strong>The</strong> cost for debris removal of the undamaged portion<br />
applies the building rate to the limit chosen. A coverage<br />
amount must be assumed to estimate the premium. For<br />
this example, this limit is assumed to be $100,000. <strong>The</strong><br />
additional premium for this limit is $500.<br />
<strong>The</strong> increased cost of construction (remember, this is<br />
applicable to the entire building) is estimated in this<br />
example at $500,000. For this amount of coverage, the<br />
additional cost is approximately $2,500.<br />
Total additional premium for this over simplified example<br />
is estimated to be $4,500. In the New Hampshire sample<br />
case, this $4,500 would have purchased the necessary<br />
$900,000 of required additional coverage.<br />
DEVELOPING ORDINANCE OR<br />
LAW COVERAGE LIMITS<br />
Value of the undamaged portion of the structure is the<br />
easiest limit to estimate because in standard ordinance or<br />
law endorsements, no estimation is necessary. <strong>The</strong> working<br />
of this coverage part (Coverage A in the ISO endorsement)<br />
states that this part pays the difference between the<br />
amount of damage and the coverage on the building. This<br />
is logical because there is no way to estimate how much<br />
will or will not be damaged so the limit must be able to<br />
fluctuate.<br />
Removal of the undamaged portion of the building is<br />
somewhat more complex to estimate for the same reason<br />
the value of the undamaged portion does not have to be<br />
estimated. <strong>The</strong>re is no way to know before a loss how much<br />
will be damaged and how much of the building won’t be<br />
damaged. This is a pure estimate. A safe estimate may be<br />
between 5% and 10% of the building’s IRV.<br />
Where removal of the undamaged portion is a guess,<br />
developing the limit for the increased cost of construction<br />
(Coverage C) is an estimate of irreducible complexity.<br />
<strong>The</strong>re is no “standard” or proven way to calculate the<br />
necessary limit. Only a best-guess estimate is possible.<br />
<strong>The</strong> estimation is a function of the age and condition of<br />
the building coupled with the changes in building codes<br />
over time.<br />
Although estimating the increased cost of construction<br />
is complex, some methodology must be behind the best<br />
guess estimate. One explainable method addresses age,<br />
condition and code changes applying a type of “dollar<br />
cost averaging” to developing the limit. Following is a<br />
reasonable and explainable methodology for developing<br />
an increased cost of construction limit.<br />
28 THE BIG I VIRGINIA WINTER <strong>2022</strong>-<strong>23</strong>
1. Choose a percentage of building value based on the<br />
age band;<br />
2. Multiply the applicable percentage by the value of<br />
the building; and<br />
3. Multiply the answer in “2.” by the age of the building.<br />
Example: 20-yr-old building valued at $1 million applying<br />
the 2% per year cost average.<br />
($1,000,000 * .02) * 20 = $400,000 Coverage C Limit<br />
<strong>The</strong> applicable age bands are:<br />
• 0-10 years: 1%<br />
• 11-20 years: 2%<br />
• 21-30 years: 3%<br />
• 31-40 years: 4%<br />
• 41-50 years: 5%<br />
• 51+ years: 6%<br />
Rather than choosing individual limits for removal<br />
(Coverage B) and increased cost of construction (Coverage<br />
C), the better choice is to combine these two coverages<br />
under one limit. This way if one is less than anticipated and<br />
the other is more costly than anticipated, the limits can be<br />
used for either expense.<br />
RECONSTRUCTION COST –<br />
BEYOND ORDINANCE OR LAW<br />
Ordinance or law is the primary method for “guaranteeing”<br />
(as much as possible) reconstruction cost. As a disclaimer,<br />
full reconstruction cost can never be guaranteed, but<br />
applying the proper methodologies and coverages allows<br />
the insured to get as close as possible.<br />
Other coverage options often necessary to accomplish the<br />
goal of reconstruction cost include:<br />
• 100% insurance to value (ITV);<br />
• Replacement cost;<br />
• Blanket limits; and<br />
• Inflation guard protection.<br />
INSURANCE TO VALUE (ITV)<br />
A provision within the CPP allows the insured to purchase<br />
less than the property’s 100% replacement cost to be fully<br />
insured for partial losses. <strong>The</strong> coinsurance provision allows<br />
the insured to carry 80% of the total insurable value and still<br />
be fully covered for any loss less than the limit carried.<br />
As is evident, the gap in this allowance is that the insured is<br />
not fully protected if the loss exceeds the limit of coverage<br />
purchased. <strong>The</strong> maximum paid by the insurance carrier is<br />
the policy limits carried. If the insured purchases limits less<br />
than the 100% insurable value, reconstruction cost cannot<br />
be obtained.<br />
REPLACEMENT COST<br />
Two valuation methods are common to insurance: 1) actual<br />
cash value; and 2) replacement cost. Actual cash value, in<br />
simplest terms, is the remaining life value of the property.<br />
Replacement cost, as the term suggests, does not consider<br />
the “used up” value, it values the property based on what<br />
a new piece of property would cost.<br />
BLANKET LIMITS<br />
When protection is provided on a blanket limit basis,<br />
one limit applies to multiple properties, multiple types<br />
of properties or a combination of the two. For instance, a<br />
blanket limit can apply to:<br />
• Multiple buildings;<br />
• Business personal property (contents) located within<br />
multiple buildings;<br />
• Combined values of real and personal property in one<br />
building; or<br />
• Combined values of real and personal property across<br />
multiple buildings.<br />
<strong>The</strong> advantage of blanket limits is that the entire limit is<br />
theoretically available for any one loss. If coverage for<br />
real property (the building) is miscalculated and too low,<br />
the difference may be made up by the remaining blanket<br />
amount. Obviously, the advantage of blanket limits is<br />
reduced when multiple properties or multiple types of<br />
property included in the blanket limit are damaged in<br />
one loss.<br />
However, there is a potential limitation to blanket limits<br />
that must be considered – the Margin Clause.<br />
Insurance Services Office (ISO) introduced the Margin<br />
Clause in 2007. More specifically known as, Limitation on<br />
Loss Settlement-Blanket Insurance (Margin Clause), the<br />
endorsement limits the payout for any one property or<br />
property type to a specific percentage of the limit provided<br />
by the insured in a statement of values for that building or<br />
business personal property. ISO’s available options are:<br />
• 105%<br />
• 110%<br />
• 120%<br />
• 130%<br />
<strong>The</strong> percentage is applied to the insurance value in the<br />
statement of values to develop the maximum payment for<br />
that particular property. Applying this limitation takes away<br />
the ability to use the entire limit for any one loss.<br />
For instance, if the property covers three buildings as<br />
follows:<br />
• Building 1: $200,000<br />
• Building 2: $250,000<br />
WINTER <strong>2022</strong>-<strong>23</strong> THE BIG I VIRGINIA 29
• Building 3: $100,000<br />
<strong>The</strong> blanket limit is $550,000. Applying traditional blanket<br />
limits, this total is available for any covered loss to any one<br />
of these three buildings.<br />
If Building 1 suffered a total loss and the actual replacement<br />
cost was $300,000, the entire loss would be covered by the<br />
blanket limit.<br />
However, if a margin clause is attached that applies the<br />
120% option, the maximum available to any one building is:<br />
• Building 1: $240,000<br />
• Building 2: $300,000<br />
• Building 3: $120,000<br />
(Obviously, if all three are destroyed in the same event, the<br />
maximum paid is the policy limit.)<br />
Because of the margin clause, if Building 1 suffered a total<br />
loss requiring $300,000 to replace, the maximum the policy<br />
would pay is $240,000. <strong>The</strong> insured would be out of pocket<br />
$60,000 due to the margin clause.<br />
If the carrier requires attachment of a margin clause,<br />
the highest allowable percentage should be used.<br />
Interestingly, use of a margin clause does lower the<br />
premium attributable to blanket coverage.<br />
INFLATION GUARD OPTION<br />
Unexpected events can increase the cost of reconstruction<br />
during the policy period. Higher than expected building<br />
costs, a natural disaster, a disruption in the construction<br />
material supply chain, an increase in labor costs, etc. are all<br />
possible. Such events increase the cost of reconstruction.<br />
Within the CPP is the option to apply a hedge against<br />
these unexpected increases known as Inflation Guard.<br />
This coverage<br />
option increases<br />
the amount of<br />
coverage on a<br />
daily, pro-rata basis<br />
throughout the policy<br />
term.<br />
For example, assume a building<br />
valued at $100,000 has the 6%<br />
inflation guard option added to the<br />
policy. Six months into the policy term the insured has<br />
$103,000 available if needed (1/2 of 6%). <strong>The</strong> amount of<br />
coverage increases a small amount each day.<br />
Applying the inflation guard option is one more step<br />
in hitting or getting as close to possible to a structure’s<br />
reconstruction cost. <strong>The</strong> available inflation guard<br />
percentages begin at 2%. According to ISO rules, the<br />
percentage is in 2% increments and can be as high as the<br />
carrier will allow (thus the maximum percentage varies<br />
Reconstruction Cost<br />
Ordinance or Law<br />
Blanket Limits<br />
Inflation Guard<br />
100% Insurance to Value<br />
Replacement Cost<br />
from carrier to carrier). Each 2% increment adds about 1%<br />
to the property premium.<br />
BUILDING TO<br />
RECONSTRUCTION COST<br />
Developing and building to reconstruction cost requires<br />
the use of many different options and endorsements<br />
available within the commercial property program. Given<br />
the information provided in this report, following is a chart<br />
demonstrating how these parts build to reconstruction cost.<br />
COVID AND<br />
RECONSTRUCTION COST<br />
COVID has created conditions no one (well, maybe a<br />
few) ever anticipated. <strong>The</strong> cost of building materials<br />
has skyrocketed during the shutdowns and subsequent<br />
movements towards reopening. Supply chains have been<br />
disrupted, delaying delivery of materials; individuals and<br />
businesses have undertaken renovations and additions<br />
due to time (and boredom), causing increased demand.<br />
Contractors are booked solid, causing labor and timing<br />
issues.<br />
Because of COVID and the resulting issues, insurance<br />
professionals must address the realities of reconstruction<br />
costs with their clients. Even if an inflation guard<br />
endorsement is attached, the percentage is likely too low<br />
in wake of the current situation.<br />
Mid-term limit adjustments may be necessary. At the very<br />
least, notify insureds via a letter or other communication<br />
of the current construction cost reality and document the<br />
notification in the client’s file.<br />
30 THE BIG I VIRGINIA WINTER <strong>2022</strong>-<strong>23</strong>
Employees are essential to a<br />
Employees are essential to a<br />
business’s productivity and<br />
business’s productivity and<br />
success, so it makes sense to have<br />
success, so it makes sense to have<br />
coverage that protects them.<br />
coverage that protects them.<br />
Summit is here—not only to<br />
Summit is here—not only to<br />
provide premier workers’ comp<br />
provide premier workers’ comp<br />
coverage—but to offer resources<br />
coverage—but to offer resources<br />
to help educate your clients on<br />
to help educate your clients on<br />
safe work practices and to aid in<br />
safe work practices and to aid in<br />
injury prevention.<br />
injury prevention.<br />
summitholdings.com<br />
Policies are underwritten by Bridgefield Casualty Insurance Company and and Bridgefield Employers Insurance Company, authorized insurers in AL, in AL, AR, AR, FL, FL, GA, GA, IN, IN, KY, KY, LA, LA, MS, MS, NC, NC, OK, OK, SC, SC, TN, TN, TX and TX and VA; VA;<br />
BusinessFirst Insurance Company, authorized in FL, GA, IN, KY, NC, SC, TN TN and VA; VA; ©<strong>2022</strong> Summit Consulting LLC LLC (DBA (DBA Summit, the the people people who who know know workers’ comp comp LLC), LLC), PO PO Box Box 988, 988, Lakeland, Lakeland, FL 33802. FL 33802. All rights All rights reserved. reserved.<br />
WINTER <strong>2022</strong>-<strong>23</strong> THE BIG I VIRGINIA 31
MORE IMAGINATION.<br />
MORE TO LOVE<br />
FROM APPLIED. ®<br />
Workers’ Compensation • Transportation – Liability & Physical Damage • Construction – Primary & Excess Liability<br />
Homeowners – Including California Wildfire & Gulf Region Hurricane • Fine Art & Collections • Structured Insurance<br />
Financial Lines • Aviation & Space • Environmental & Pollution Liability • Property • Warranty<br />
Fronting & Program Business • Reinsurance<br />
...And More To Come.<br />
It Pays To Get A Quote From Applied.®<br />
Learn more at auw.com/MoreToLove<br />
or call sales (877) <strong>23</strong>4-4450<br />
©<strong>2022</strong> Applied Underwriters, Inc. Rated A (Excellent) by AM Best. Insurance plans protected U.S. Patent No. 7,908,157.