The Big I Virginia Winter 2022-23

You also want an ePaper? Increase the reach of your titles
YUMPU automatically turns print PDFs into web optimized ePapers that Google loves.
Professional and Business Services<br />
Frequency Impacts of Worker Mix Changes<br />
<strong>The</strong> Introduction<br />
pandemic’s main effect on Professional and Business <strong>The</strong> discussion thus far has focused on the share of shorttenured<br />
and remote is historically workers by low, sector but labor and their force relative<br />
Services <strong>The</strong> Great was a Reshuffle dramatic rise reshaping remote work. the US Our labor scenarios market. Unemployment<br />
for participation this sector focus is still on lower changes than in the pre-pandemic share of remote rate. Labor risks. But shortages another have effect led of to the wage pandemic growth, was especially a change in<br />
workers<br />
strong<br />
rather<br />
among<br />
than<br />
low-wage<br />
the share of<br />
workers<br />
short-tenured<br />
and in sectors<br />
workers.<br />
like Leisure the mix and of Hospitality. business. What net frequency effect would we<br />
As we have shown, the share of remote work expanded expect to see from all three types of change together—<br />
rapidly Quit in rates 2020 jumped due to in the the pandemic. middle of 2021 While and the remain share high share at the of short-tenured time of this writing—about workers, share of 50 remote million workers, quits a<br />
partially year, receded almost 10 in 2021, million it more remained than dramatically pre-pandemic higher averages. and changing Many workers industry are mix—at new to an their aggregated jobs. Some level of for these an<br />
than pre-pandemic. It is not clear what to expect going entire state or representative book of business?<br />
are moving from one similar job to another, but others are changing industries or occupations. At the same<br />
forward, time, as there some are companies a large number push for of a return new remote to the office workers. <strong>The</strong> Many first people two effects left the act office in opposite at COVID’s directions. onset; Upward there has<br />
and others have made flexible or fully- remote options pressure on frequency from more short-tenured workers<br />
been a trickle back, representing a massive change in the amount of remote work compared to before the<br />
permanent. Our scenarios allow for the possibility that is partially balanced by the downward pressure from<br />
remote pandemic. work share may move in either direction in the next more remote work. While the magnitude of each of these<br />
few years.<br />
How do such large changes in the labor market impact<br />
effects<br />
workers<br />
depends<br />
compensation<br />
on the mix<br />
injury<br />
of<br />
frequency?<br />
business, most<br />
<strong>The</strong><br />
states<br />
magnitude<br />
will<br />
• Orange: <strong>The</strong> share of remote workers increases from have similar effects because the industry mix of the labor<br />
of these impacts relies on the interaction of three factors:<br />
42% in 2021 to 54% in 20<strong>23</strong>, which was the 2020 high market is similar in most states. 17 For insurance carriers,<br />
in remote • How worker much share, more or and less stays likely at are that short-tenured level in either<br />
or remote<br />
effect may<br />
workers<br />
dominate<br />
to be<br />
if<br />
injured<br />
they primarily<br />
than other<br />
write<br />
workers?<br />
policies<br />
subsequent years.<br />
in certain sectors of the economy.<br />
• How much has the share of such workers changed?<br />
• Blue: <strong>The</strong> share of remote workers continues its 2021 But what is the frequency effect from the change in mix<br />
• How has the sector mix of the workforce changed during the pandemic?<br />
decline each year through 2025, although never falling itself? We can break this question down into two parts.<br />
all the way back to pre-pandemic levels.<br />
How did the mix change? And what is the frequency metric<br />
being used? 18<br />
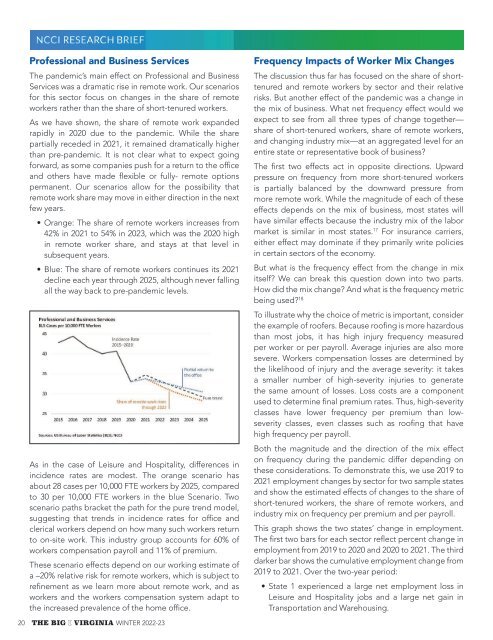
As in the case of Leisure and Hospitality, differences in<br />
incidence rates are modest. <strong>The</strong> orange scenario has<br />
about 28 cases per 10,000 FTE workers by 2025, compared<br />
to 30 per 10,000 FTE workers in the blue Scenario. Two<br />
scenario paths bracket the path for the pure trend model,<br />
suggesting that trends in incidence rates for office and<br />
clerical workers depend on how many such workers return<br />
to on-site work. This industry group accounts for 60% of<br />
workers compensation payroll and 11% of premium.<br />
<strong>The</strong>se scenario effects depend on our working estimate of<br />
a –20% relative risk for remote workers, which is subject to<br />
refinement as we learn more about remote work, and as<br />
workers and the workers compensation system adapt to<br />
the increased prevalence of the home office.<br />
20 THE BIG I VIRGINIA WINTER <strong>2022</strong>-<strong>23</strong><br />
To illustrate why the choice of metric is important, consider<br />
the example of roofers. Because roofing is more hazardous<br />
than most jobs, it has high injury frequency measured<br />
per worker or per payroll. Average injuries are also more<br />
severe. Workers compensation losses are determined by<br />
the likelihood of injury and the average severity: it takes<br />
a smaller number of high-severity injuries to generate<br />
the same amount of losses. Loss costs are a component<br />
used to determine final premium rates. Thus, high-severity<br />
classes have lower frequency per premium than lowseverity<br />
classes, even classes such as roofing that have<br />
high frequency per payroll.<br />
Both the magnitude and the direction of the mix effect<br />
on frequency during the pandemic differ depending on<br />
these considerations. To demonstrate this, we use 2019 to<br />
2021 employment changes by sector for two sample states<br />
and show the estimated effects of changes to the share of<br />
short-tenured workers, the share of remote workers, and<br />
industry mix on frequency per premium and per payroll.<br />
This graph shows the two states’ change in employment.<br />
<strong>The</strong> first two bars for each sector reflect percent change in<br />
employment from 2019 to 2020 and 2020 to 2021. <strong>The</strong> third<br />
darker bar shows the cumulative employment change from<br />
2019 to 2021. Over the two-year period:<br />
• State 1 experienced a large net employment loss in<br />
Leisure and Hospitality jobs and a large net gain in<br />
Transportation and Warehousing.