
Create successful ePaper yourself
Turn your PDF publications into a flip-book with our unique Google optimized e-Paper software.
UPWIND<br />
Page 138 of 146<br />
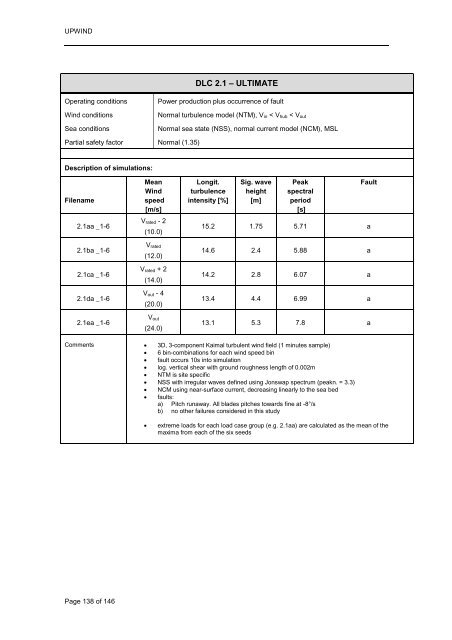
DLC 2.1 – ULTIMATE<br />
Operating conditions Power production plus occurrence of fault<br />
Wind conditions Normal turbulence model (NTM), Vin < Vhub < Vout<br />
Sea conditions Normal sea state (NSS), normal current model (NCM), MSL<br />
Partial safety factor Normal (1.35)<br />
Description of simulations:<br />
Filename<br />
2.1aa _1-6<br />
2.1ba _1-6<br />
2.1ca _1-6<br />
2.1da _1-6<br />
2.1ea _1-6<br />
Comments<br />
Mean<br />
Wind<br />
speed<br />
[m/s]<br />
Vrated - 2<br />
(10.0)<br />
Vrated<br />
(12.0)<br />
Vrated + 2<br />
(14.0)<br />
Vout - 4<br />
(20.0)<br />
Vout<br />
(24.0)<br />
Longit.<br />
turbulence<br />
intensity [%]<br />
Sig. wave<br />
height<br />
[m]<br />
Peak<br />
spectral<br />
period<br />
[s]<br />
Fault<br />
15.2 1.75 5.71 a<br />
14.6 2.4 5.88 a<br />
14.2 2.8 6.07 a<br />
13.4 4.4 6.99 a<br />
13.1 5.3 7.8 a<br />
� 3D, 3-component Kaimal turbulent wind field (1 minutes sample)<br />
� 6 bin-combinations for each wind speed bin<br />
� fault occurs 10s into simulation<br />
� log. vertical shear with ground roughness length of 0.002m<br />
� NTM is site specific<br />
� NSS with irregular waves defined using Jonswap spectrum (peakn. = 3.3)<br />
� NCM using near-surface current, decreasing linearly to the sea bed<br />
� faults:<br />
a) Pitch runaway. All blades pitches towards fine at -8°/s<br />
b) no other failures considered in this study<br />
� extreme loads for each load case group (e.g. 2.1aa) are calculated as the mean of the<br />
maxima from each of the six seeds