
You also want an ePaper? Increase the reach of your titles
YUMPU automatically turns print PDFs into web optimized ePapers that Google loves.
UPWIND<br />
5. Load mitigation concept analysis at operational<br />
control level<br />
In the following Chapter, several concepts for load mitigation in the operational control level are<br />
introduced. These concepts include already available turbine operations in order to reduce<br />
overall loading. The shown concepts just give an overview of possible options and could be<br />
extended.<br />
5.1 Rotational speed window<br />
As explained in Chapter 2, the design ranges for support structures are important from a<br />
dynamic point of view. In general, most bottom-mounted support structure concepts are<br />
designed for the soft-stiff design region, which is between the 1P and 3P of the rotor speed<br />
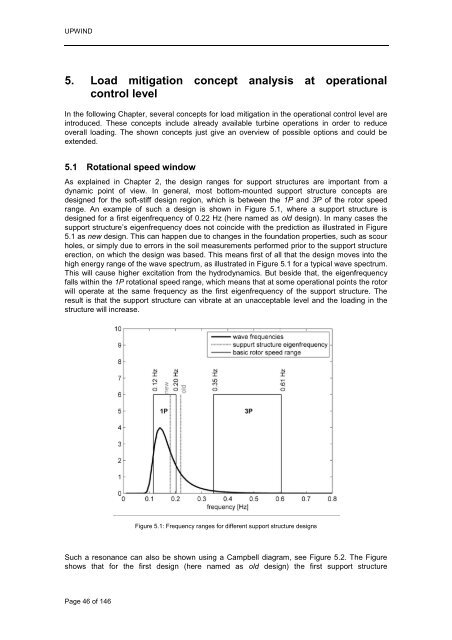
range. An example of such a design is shown in Figure 5.1, where a support structure is<br />
designed for a first eigenfrequency of 0.22 Hz (here named as old design). In many cases the<br />
support structure‟s eigenfrequency does not coincide with the prediction as illustrated in Figure<br />
5.1 as new design. This can happen due to changes in the foundation properties, such as scour<br />
holes, or simply due to errors in the soil measurements performed prior to the support structure<br />
erection, on which the design was based. This means first of all that the design moves into the<br />
high energy range of the wave spectrum, as illustrated in Figure 5.1 for a typical wave spectrum.<br />
This will cause higher excitation from the hydrodynamics. But beside that, the eigenfrequency<br />
falls within the 1P rotational speed range, which means that at some operational points the rotor<br />
will operate at the same frequency as the first eigenfrequency of the support structure. The<br />
result is that the support structure can vibrate at an unacceptable level and the loading in the<br />
structure will increase.<br />
Page 46 of 146<br />
Figure 5.1: Frequency ranges for different support structure designs<br />
Such a resonance can also be shown using a Campbell diagram, see Figure 5.2. The Figure<br />
shows that for the first design (here named as old design) the first support structure