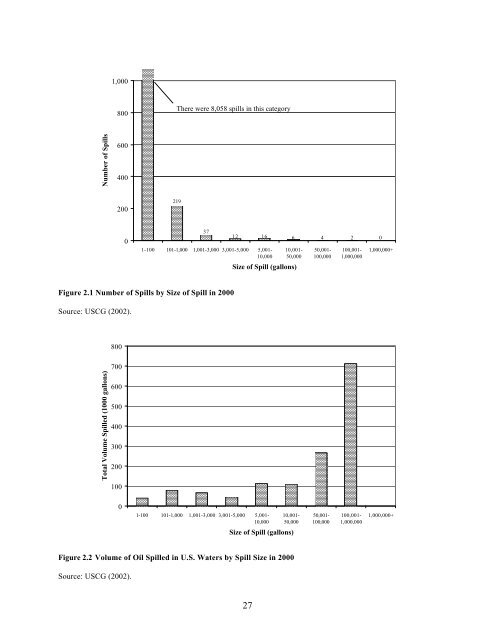
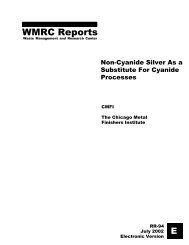
evaluate the potential for other states to adopt similar methods, <strong>and</strong> identify ways in which economists could conduct research to improve the accuracy of such methods without sacrificing their simplicity. II. Simplified NRDA methods for oil spills State trustees obtain authority to pursue NRD recovery for oil spills largely from OPA, passed in 1990, <strong>and</strong> from various state laws. The passage of OPA was prompted at least in part by the enormous Exxon-Valdez spill. However, Figures 2.1 <strong>and</strong> 2.2 make clear that while most of the oil spilled comes from large releases, most oil-spill incidents are very small. It seems sensible to have a method to assess damages from such small spills in a manner that is not resource intensive. Oil spills are not limited to coastal areas (they occur in overl<strong>and</strong> transport, at refineries, <strong>and</strong> around compromised pipelines), but coastal states do have the largest numbers of reported spills. As can be seen from Figure 2.3 below, a few states bear the effects of a disproportionate number of oil spills in U.S. waters. One might expect those states to have the most to gain from developing a simplified assessment method to deal with their heavy case load. While the state of Texas has state law dealing specifically with recovering NRDs from oil spills, that law does not authorize or specify a simplified assessment method. Louisiana trustees are investigating the use <strong>and</strong>/or modification of a Wetl<strong>and</strong> Value <strong>Assessment</strong> methodology that was originally designed to evaluate wetl<strong>and</strong> enhancement projects proposed for funding under the Coastal Wetl<strong>and</strong>s Planning, Protection, <strong>and</strong> Restoration Act (CWPPRA). At the time of our survey, the trustee agency in California did not use a compensation table or formula, opting instead to use casespecific Habitat Equivalency Analysis for all the spills it h<strong>and</strong>led. Since then California staff members have developed a simplified method for use in small cases; for details, see Ando <strong>and</strong> Khanna (2004). In this chapter, we report on the assessment methods used by agencies in Florida <strong>and</strong> Washington (marked in black on the figure) for all but the biggest spills; each of those methods is established by state law. A. Washington Environmental contamination of the navigable waters of Washington by spills from vessels transporting oil into the state is a matter of concern to the state. Oil spills are recognized to cause injuries to fishing, tourism, recreation <strong>and</strong> the aesthetic value of natural resources in the state. The technology for containing <strong>and</strong> cleaning up an oil spill is not very well developed; therefore, prevention is a less costly <strong>and</strong> more effective way of protecting the environment. Among efforts to establish a spill prevention <strong>and</strong> response program, the state acts as the trustee of the state’s natural resources to ensure that PRPs respond to spills <strong>and</strong> provide compensation for all costs <strong>and</strong> damages. The legislature has declared that while some damages are easily quantifiable <strong>and</strong> recovered by the state, it is also true that “compensation should be sought for those damages that cannot be quantified at a reasonable cost <strong>and</strong> for unquantifiable damages that result from oil spills. This compensation is intended to ensure that the public does not bear substantial losses caused by oil pollution for which compensation may not be otherwise received” (Washington, 2001, § 010.) In addition to compensating the state for damages, the PRP is obliged immediately to collect <strong>and</strong> remove the contaminant <strong>and</strong> is liable for reimbursing 26
Number of Spills 1,000 800 600 400 200 0 There were 8,058 spills in this category 1-100 101-1,000 1,001-3,000 3,001-5,000 5,001- 10,000 Figure 2.1 Number of Spills by Size of Spill in 2000 Source: USCG (2002). Total Volume Spilled (1000 gallons) 800 700 600 500 400 300 200 100 0 219 37 12 16 6 4 2 0 27 10,001- 50,000 Size of Spill (gallons) 1-100 101-1,000 1,001-3,000 3,001-5,000 5,001- 10,000 10,001- 50,000 Size of Spill (gallons) Figure 2.2 Volume of Oil Spilled in U.S. Waters by Spill Size in 2000 Source: USCG (2002). 50,001- 100,000 50,001- 100,000 100,001- 1,000,000 100,001- 1,000,000 1,000,000+ 1,000,000+